


Additional resources
What Are Database Specialists for Data VisualizationData Pipeline DevelopmentInteractive Dashboard CreationReal-Time Data ProcessingCross-Platform Visualization DesignKey Skills to Look for in Data Visualization SpecialistsDatabase Management ExpertiseSQL and NoSQL ProficiencyVisualization Tool MasteryCloud Platform IntegrationStatistical Analysis KnowledgeWhere to Find Database Visualization ExpertsProfessional Networks and CommunitiesIndustry-Specific Job BoardsUniversity Partnership ProgramsData Science ConferencesRemote Work PlatformsHow to Evaluate Data Visualization ConsultantsPortfolio Assessment CriteriaTechnical Screening MethodsLive SQL Challenge ExercisesVisualization Project PresentationsProblem-Solving ScenariosCompensation Rates for Database Reporting SpecialistsFull-Time Salary BenchmarksHourly Consulting RatesProject-Based Pricing ModelsGeographic Pay VariationsExperience Level ImpactInterview Process for Data Viz SpecialistsStep 1: Initial Technical ScreeningStep 2: Portfolio Deep DiveStep 3: Hands-On AssessmentStep 4: Team Collaboration ExerciseStep 5: Final Stakeholder InterviewWorking Models for Database Visualization TeamsIn-House Team StructureHybrid Remote ArrangementsContract-to-Hire OptionsProject-Based EngagementsEssential Tools and TechnologiesEnterprise Visualization PlatformsProgramming Libraries for Custom SolutionsCloud-Native Analytics ServicesReal-Time Streaming ToolsVersion Control SystemsBuilding Effective Data Analysis and Visualization TeamsRole Definition and ResponsibilitiesCross-Functional Collaboration SetupKnowledge Sharing PracticesPerformance Metrics FrameworkCommon Hiring Challenges and SolutionsTechnical Skill GapsCommunication Barrier ResolutionRetention Strategy DevelopmentOnboarding Process OptimizationFuture-Proofing Your Visualization TalentAI-Augmented Visualization SkillsEmerging Technology TrainingContinuous Learning ProgramsCareer Development Pathways
Organizations today need database specialists for data visualization who can transform complex data into actionable insights through compelling visual narratives. These professionals combine technical database expertise with design sensibilities to create dashboards, reports, and interactive visualizations that drive data-driven decisions across all business levels.
What Are Database Specialists for Data Visualization
Data visualization specialists serve as the bridge between raw database information and strategic business intelligence. They extract, process, and present data in formats that enable stakeholders to identify patterns, trends, and anomalies quickly. These professionals work with various database systems, from traditional relational databases to modern NoSQL platforms, ensuring data flows seamlessly into visualization tools.
Data Pipeline Development
Data pipeline development forms the foundation of effective visualization work. Specialists design and implement ETL processes that extract information from multiple sources, transform it according to business requirements, and load it into formats optimized for visualization tools. This involves writing complex SQL queries, managing data transformations, and ensuring data quality throughout the pipeline.
The pipeline architecture typically includes automated data validation checks, error handling mechanisms, and monitoring systems that alert teams to potential issues. Specialists configure these pipelines to handle both batch processing for historical analysis and streaming data for real-time insights.
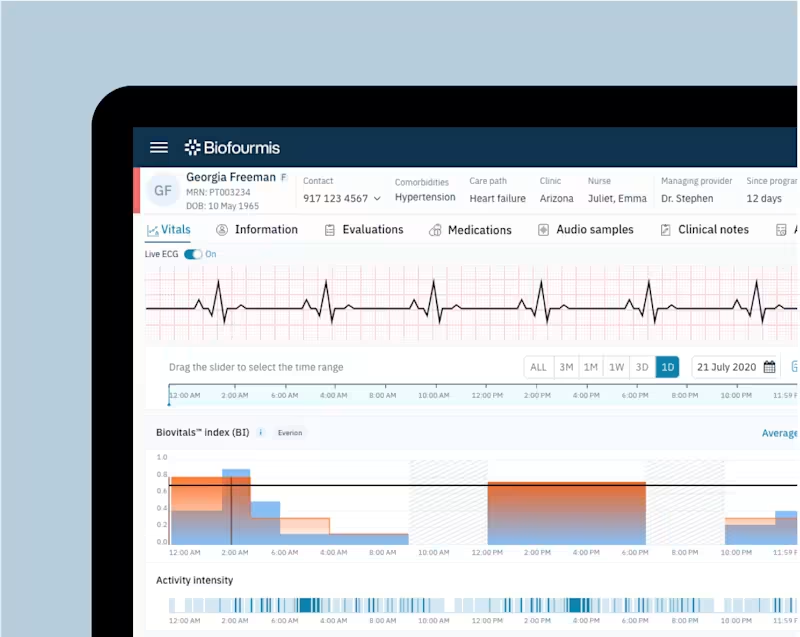
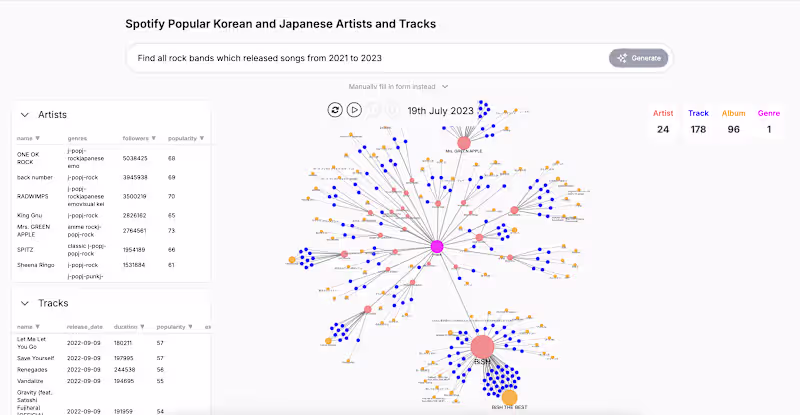
Interactive Dashboard Creation
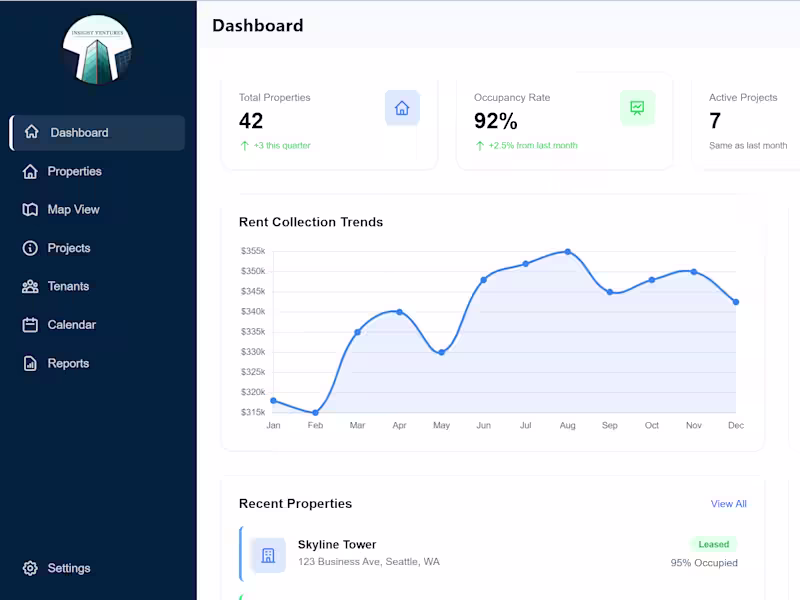
Dashboard creation requires both technical skills and user experience design principles. Specialists build interactive interfaces that allow users to filter, drill down, and explore data dynamically. They implement features like parameter controls, calculated fields, and responsive layouts that adapt to different screen sizes and user needs.
Effective dashboards balance information density with clarity, using color coding, typography, and spatial organization to guide user attention to key metrics. Specialists often create multiple dashboard versions tailored to different audience levels, from executive summaries to detailed operational reports.
Real-Time Data Processing
Real-time data processing capabilities enable organizations to respond quickly to changing conditions. Specialists implement streaming data architectures that capture, process, and visualize information as it arrives. This involves configuring message queues, setting up data buffers, and optimizing query performance for low-latency updates.
The technical implementation often includes caching strategies, incremental refresh schedules, and alert systems that notify users when key metrics exceed predefined thresholds. Specialists balance update frequency with system performance to ensure dashboards remain responsive while providing timely insights.
Cross-Platform Visualization Design
Cross-platform design ensures visualizations function consistently across web browsers, mobile devices, and embedded applications. Specialists create responsive layouts that maintain readability and functionality regardless of screen size or device capabilities. They optimize loading times, implement progressive data loading, and ensure accessibility compliance.
This work involves testing visualizations across different environments, optimizing for various network conditions, and implementing fallback options for older browsers or limited connectivity scenarios.
Key Skills to Look for in Data Visualization Specialists
Successful database visualization experts combine technical database management skills with visualization design expertise. The most effective specialists demonstrate proficiency across multiple technology stacks while maintaining strong communication abilities to translate technical concepts for business stakeholders.
Database Management Expertise
Database management expertise encompasses both relational and non-relational database systems. Specialists understand database design principles, normalization concepts, and performance optimization techniques. They work with various database platforms, implementing efficient data models that support visualization requirements.
Key competencies include index optimization, query performance tuning, and database administration tasks like backup management and security configuration. Specialists also understand data warehousing concepts and dimensional modeling approaches that facilitate analytical queries.
SQL and NoSQL Proficiency
SQL proficiency extends beyond basic query writing to include advanced techniques like window functions, common table expressions, and stored procedure development. Specialists write complex joins across multiple tables, implement aggregation logic, and optimize queries for large datasets.
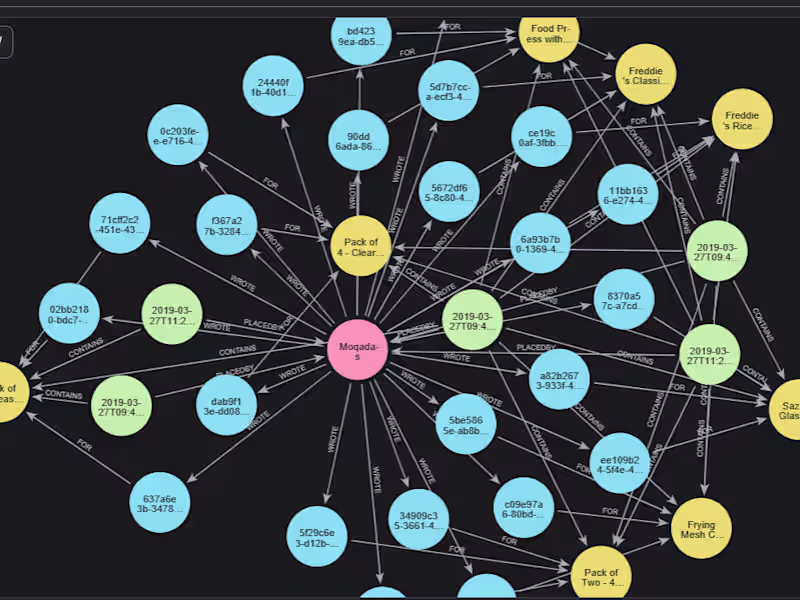
NoSQL expertise covers document databases, key-value stores, and graph databases. Specialists understand when to use different NoSQL approaches and how to structure data for optimal visualization performance. They work with JSON documents, implement map-reduce operations, and handle schema-less data structures.
Visualization Tool Mastery
Visualization tool mastery involves proficiency with enterprise platforms and programming libraries. Specialists work with BI tools like Tableau, Power BI, and Qlik, understanding their capabilities, limitations, and integration options. They create custom visualizations using programming libraries like D3.js, Plotly, and Chart.js when standard tools cannot meet specific requirements.
Advanced specialists develop custom connectors, implement embedded analytics solutions, and create white-label visualization applications. They understand the trade-offs between different tools and recommend appropriate solutions based on technical requirements and budget constraints.
Cloud Platform Integration
Cloud platform integration skills enable specialists to leverage scalable infrastructure and managed services. They work with AWS, Azure, and Google Cloud Platform, implementing cloud-native analytics solutions that automatically scale based on demand.
Specialists configure cloud databases, implement serverless analytics functions, and integrate with cloud-based visualization services. They understand cost optimization strategies, security configurations, and compliance requirements for cloud deployments.
Statistical Analysis Knowledge
Statistical analysis knowledge helps specialists identify meaningful patterns and avoid common analytical pitfalls. They understand concepts like correlation versus causation, statistical significance, and sampling bias. This knowledge informs their visualization design decisions and helps them present data accurately.
Specialists apply statistical techniques to identify outliers, trend analysis, and predictive modeling. They understand when to use different chart types and how to present uncertainty and confidence intervals effectively.
Where to Find Database Visualization Experts
Finding qualified data visualization consultants requires exploring multiple channels, from professional networks to specialized job boards. The most successful hiring strategies combine traditional recruitment methods with modern platforms that cater specifically to data professionals.
Professional Networks and Communities
Professional networks provide access to experienced practitioners who actively engage with the data visualization community. LinkedIn groups, industry associations, and local meetups offer opportunities to connect with specialists who demonstrate thought leadership and practical experience.
Active community members often share insights through blog posts, conference presentations, and open-source contributions. These activities provide valuable indicators of technical expertise and communication skills that translate well to client-facing roles.
Industry-Specific Job Boards
Industry-specific job boards attract candidates with relevant domain expertise. Healthcare, finance, and manufacturing sectors often require specialists who understand industry-specific regulations, data types, and analytical requirements.
These platforms typically feature candidates with security clearances, compliance certifications, and experience with industry-standard tools and methodologies. The focused candidate pool often results in better cultural fit and reduced onboarding time.
University Partnership Programs
University partnership programs provide access to emerging talent with current technical skills and fresh perspectives. Graduate programs in data science, statistics, and computer science produce candidates familiar with modern tools and methodologies.
Internship programs allow organizations to evaluate candidates over extended periods while providing valuable real-world experience. Many universities also offer continuing education programs that help working professionals develop visualization skills.
Data Science Conferences
Data science conferences offer networking opportunities with both established professionals and emerging talent. Events like Strata Data Conference, Tableau Conference, and local data meetups provide venues for identifying candidates who stay current with industry trends.
Conference speakers and workshop leaders often possess deep expertise and strong communication skills. Engaging with professionals at these events allows for informal assessment of technical knowledge and cultural fit.
Remote Work Platforms
Remote work platforms expand the talent pool beyond geographic constraints while often providing access to cost-effective expertise. These platforms typically include rating systems, portfolio reviews, and skills assessments that help evaluate candidate qualifications.
The global talent pool available through remote platforms often includes specialists with unique skill combinations or niche expertise that may not be available locally. Time zone considerations and communication preferences become important factors in the selection process.
How to Evaluate Data Visualization Consultants
Evaluating data visualization specialists requires a comprehensive assessment approach that examines both technical capabilities and soft skills. The evaluation process should include portfolio reviews, hands-on assessments, and scenario-based exercises that simulate real-world challenges.
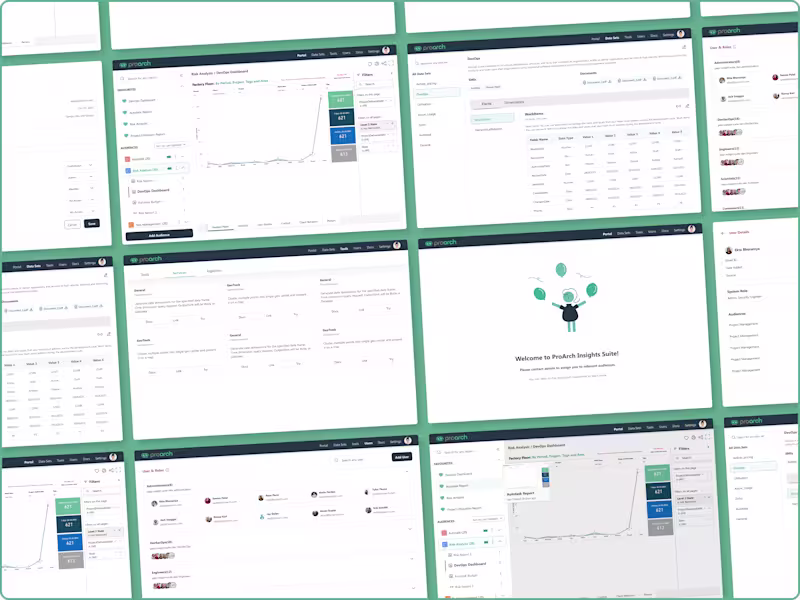
Portfolio Assessment Criteria
Portfolio assessment provides insights into a candidate's design sensibilities, technical capabilities, and project complexity experience. Strong portfolios demonstrate progression in skill development, variety in project types, and clear explanations of problem-solving approaches.
Key evaluation criteria include visual design quality, technical implementation complexity, and business impact documentation. Portfolios should show examples of interactive visualizations, mobile-responsive designs, and integration with various data sources.
Technical Screening Methods
Technical screening methods evaluate core competencies through structured assessments. These may include coding challenges, database design exercises, and tool-specific tasks that reflect actual job requirements.
Effective screening combines automated assessments with human review to evaluate both technical accuracy and code quality. The screening process should test data analysis skills, visualization design principles, and problem-solving approaches under time constraints.
Live SQL Challenge Exercises
Live SQL challenge exercises assess real-time problem-solving abilities and communication skills. Candidates work through database queries while explaining their approach, revealing both technical competency and teaching ability.
These exercises should include scenarios with missing data, performance optimization requirements, and business logic implementation. The interactive format allows evaluation of debugging skills and adaptability when initial approaches encounter obstacles.
Visualization Project Presentations
Visualization project presentations evaluate communication skills and design thinking processes. Candidates present completed projects, explaining design decisions, technical challenges, and business outcomes achieved through their work.
Strong presentations demonstrate the ability to tailor explanations for different audiences, defend design choices with data-driven reasoning, and articulate the business value of technical decisions. This assessment reveals crucial client-facing skills.
Problem-Solving Scenarios
Problem-solving scenarios test analytical thinking and creativity under realistic constraints. Candidates receive business problems with incomplete information, competing requirements, and resource limitations that mirror actual project challenges.
These exercises evaluate prioritization skills, stakeholder management approaches, and technical creativity. The scenarios should include trade-off decisions between performance, functionality, and timeline constraints.
Compensation Rates for Database Reporting Specialists
Database reporting specialists command competitive compensation across various engagement models. Understanding market rates helps organizations structure attractive offers while managing budget constraints effectively.
Full-Time Salary Benchmarks
Full-time salary benchmarks vary significantly based on location, experience level, and industry sector. Entry-level positions typically start around $65,000 annually, while senior specialists with 5+ years experience command $120,000 to $180,000 in major metropolitan areas.
Specialized skills in emerging technologies, industry expertise, or leadership capabilities can increase compensation by 20-40% above baseline rates. Stock options, performance bonuses, and professional development budgets often supplement base salaries.
Hourly Consulting Rates
Hourly consulting rates provide flexibility for project-based work and specialized expertise. Independent consultants typically charge $75-150 per hour, with premium rates for urgent projects or highly specialized skills.
Factors influencing hourly rates include project complexity, timeline constraints, industry requirements, and consultant reputation. Long-term contracts often feature reduced hourly rates in exchange for guaranteed work volume.
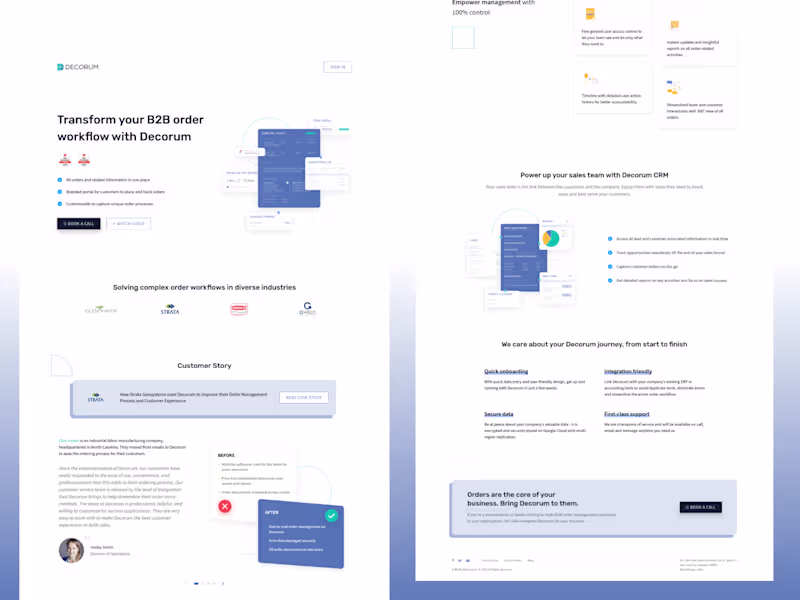
Project-Based Pricing Models
Project-based pricing models align consultant incentives with business outcomes while providing cost predictability for clients. Fixed-price projects typically range from $15,000 for basic dashboard development to $100,000+ for comprehensive analytics platforms.
Value-based pricing considers the business impact of visualization projects, potentially resulting in higher compensation for consultants who deliver measurable improvements in decision-making speed or accuracy.
Geographic Pay Variations
Geographic pay variations reflect local market conditions, cost of living differences, and talent availability. Technology hubs like San Francisco, New York, and Seattle typically offer 30-50% higher compensation than secondary markets.
Remote work opportunities increasingly allow specialists to access higher-paying markets while maintaining lower living costs. This trend has reduced but not eliminated geographic pay disparities.
Experience Level Impact
Experience level significantly impacts compensation across all engagement models. Junior specialists (0-2 years) typically earn 40-60% of senior specialist rates, while principal-level experts with 10+ years experience command premium rates.
Career progression often involves transitioning from individual contributor roles to team leadership, client management, or specialized consulting positions that leverage accumulated expertise and industry relationships.
Interview Process for Data Viz Specialists
A structured interview process for hire data viz specialists ensures comprehensive evaluation while providing candidates with clear expectations. The multi-stage approach balances efficiency with thorough assessment of both technical and soft skills.
Step 1: Initial Technical Screening
Initial technical screening filters candidates based on core competencies and basic qualifications. This stage typically includes automated assessments of SQL skills, visualization tool knowledge, and fundamental statistical concepts.
The screening process should take 30-45 minutes and cover essential skills without requiring extensive time investment from either party. Clear pass/fail criteria help maintain consistency across multiple candidates.
Step 2: Portfolio Deep Dive
Portfolio deep dive sessions allow detailed discussion of past projects and design decisions. Candidates present 2-3 projects in detail, explaining technical challenges, stakeholder requirements, and outcomes achieved.
This stage evaluates communication skills, design thinking processes, and ability to learn from past experiences. Interviewers should probe technical implementation details and business impact measurement approaches.
Step 3: Hands-On Assessment
Hands-on assessment provides direct observation of working methods and problem-solving approaches. Candidates complete a realistic project using provided data and tools within a specified timeframe.
The assessment should mirror actual job responsibilities while remaining achievable within the allocated time. Evaluation criteria should include technical accuracy, design quality, and documentation completeness.
Step 4: Team Collaboration Exercise
Team collaboration exercises evaluate interpersonal skills and cultural fit. Candidates participate in mock stakeholder meetings, present findings to simulated business users, or collaborate on problem-solving with potential teammates.
This stage reveals communication style, conflict resolution approaches, and ability to translate technical concepts for non-technical audiences. Group dynamics and leadership potential become apparent through structured interactions.
Step 5: Final Stakeholder Interview
Final stakeholder interviews involve senior decision-makers and potential project sponsors. These conversations focus on strategic thinking, business acumen, and long-term potential within the organization.
Topics typically include career goals, industry insights, and approaches to emerging challenges in data visualization. This stage confirms mutual fit and addresses any remaining concerns from either party.
Working Models for Database Visualization Teams
Organizations can structure data analysis and visualization teams using various models that balance cost, flexibility, and strategic control. The optimal approach depends on project scope, budget constraints, and long-term organizational goals.
In-House Team Structure
In-house team structures provide maximum control and institutional knowledge retention. Full-time employees develop deep understanding of business requirements, data sources, and organizational culture over time.
This model works best for organizations with consistent visualization needs, sensitive data requirements, or complex integration challenges. The higher upfront investment typically pays dividends through improved efficiency and reduced knowledge transfer overhead.
Hybrid Remote Arrangements
Hybrid remote arrangements combine the benefits of in-house expertise with access to global talent pools. Teams include core full-time members supplemented by remote specialists for specific projects or skill gaps.
This approach provides flexibility to scale capacity based on project demands while maintaining continuity through permanent team members. Communication protocols and collaboration tools become critical success factors.
Contract-to-Hire Options
Contract-to-hire options allow extended evaluation periods before making permanent commitments. Organizations can assess candidate performance, cultural fit, and long-term potential through real project work.
This model reduces hiring risks while providing candidates with income during the evaluation period. Clear expectations and conversion criteria help maintain positive relationships regardless of final decisions.
Project-Based Engagements
Project-based engagements provide access to specialized expertise for defined deliverables. This model works well for organizations with sporadic visualization needs or specific technical challenges requiring niche skills.
Success depends on clear project scoping, well-defined deliverables, and effective knowledge transfer processes. Organizations should plan for ongoing maintenance and support requirements beyond initial project completion.
Essential Tools and Technologies
Modern database specialists work with diverse technology stacks that continue evolving rapidly. Understanding current tool landscapes helps organizations make informed decisions about technology investments and skill requirements.
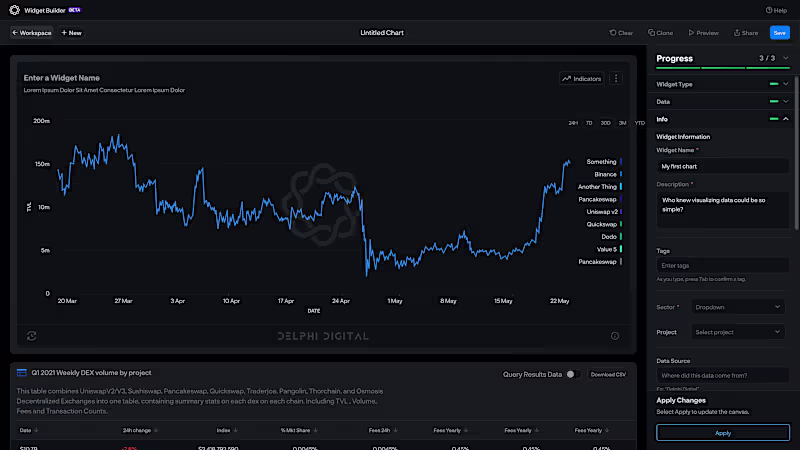
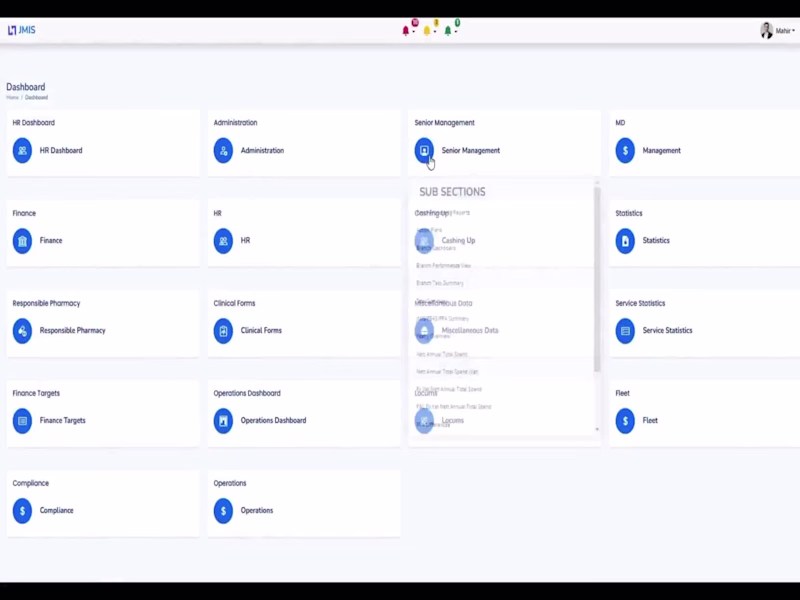
Enterprise Visualization Platforms
Enterprise visualization platforms provide comprehensive analytics capabilities with enterprise-grade security, scalability, and support. These tools typically offer drag-and-drop interfaces, extensive customization options, and integration with multiple data sources.
Leading platforms include advanced features like natural language querying, automated insight generation, and embedded analytics capabilities. Licensing costs vary significantly based on user count, feature requirements, and deployment models.
Programming Libraries for Custom Solutions
Programming libraries enable custom visualization development when standard tools cannot meet specific requirements. Popular options include D3.js for web-based visualizations, Python libraries like Matplotlib and Plotly, and R packages for statistical graphics.
Custom development provides unlimited flexibility but requires more technical expertise and longer development timelines. Organizations should consider maintenance requirements and skill availability when choosing between custom and commercial solutions.
Cloud-Native Analytics Services
Cloud-native analytics services provide scalable infrastructure and managed services that reduce operational overhead. These platforms typically offer pay-per-use pricing models and automatic scaling based on demand.
Integration with other cloud services simplifies data pipeline development and reduces infrastructure complexity. Organizations should evaluate vendor lock-in risks and data sovereignty requirements when adopting cloud solutions.
Real-Time Streaming Tools
Real-time streaming tools enable live data visualization for time-sensitive applications. These technologies process continuous data streams and update visualizations with minimal latency.
Implementation requires careful consideration of data volume, update frequency, and user concurrency requirements. Performance optimization becomes critical for maintaining responsive user experiences with high-velocity data streams.
Version Control Systems
Version control systems provide essential infrastructure for collaborative development and change management. These tools track visualization code, configuration files, and documentation changes over time.
Proper version control enables rollback capabilities, branch-based development workflows, and audit trails for compliance requirements. Integration with deployment pipelines automates testing and release processes.
Building Effective Data Analysis and Visualization Teams
Successful teams combine diverse skills and perspectives while maintaining clear communication channels and shared objectives. Team structure should reflect organizational needs, project complexity, and available resources.
Role Definition and Responsibilities
Clear role definitions prevent overlap and ensure comprehensive coverage of required capabilities. Teams typically include data engineers, visualization designers, business analysts, and project managers with distinct but complementary responsibilities.
Role boundaries should be flexible enough to accommodate skill development and project requirements while maintaining accountability for specific deliverables. Regular role reviews help teams adapt to changing organizational needs.
Cross-Functional Collaboration Setup
Cross-functional collaboration requires structured processes and communication protocols. Regular meetings, shared documentation standards, and collaborative tools help maintain alignment across different functional areas.
Successful collaboration often involves embedding team members within business units to better understand requirements and build stronger stakeholder relationships. This approach improves solution relevance and user adoption rates.
Knowledge Sharing Practices
Knowledge sharing practices ensure expertise spreads throughout the team and organization. Regular technical presentations, documentation standards, and mentoring programs help build collective capabilities.
Communities of practice, both internal and external, provide venues for sharing best practices and staying current with industry developments. Investment in conference attendance and training programs demonstrates organizational commitment to continuous learning.
Performance Metrics Framework
Performance metrics frameworks provide objective measures of team effectiveness and individual contribution. Metrics should balance technical excellence with business impact and user satisfaction.
Key performance indicators might include project delivery timelines, visualization accuracy, user engagement rates, and business decision impact. Regular metric reviews help identify improvement opportunities and recognize outstanding performance.
Common Hiring Challenges and Solutions
Organizations face recurring challenges when hiring visualization specialists, from technical skill gaps to cultural fit issues. Understanding common problems and proven solutions helps improve hiring success rates.
Technical Skill Gaps
Technical skill gaps often result from rapid technology evolution and limited training opportunities. The shortage of candidates with both database expertise and visualization design skills creates competitive hiring markets.
Solutions include developing internal training programs, partnering with educational institutions, and creating apprenticeship opportunities for candidates with foundational skills. Investment in skill development often proves more cost-effective than competing for scarce experienced talent.
Communication Barrier Resolution
Communication barriers between technical specialists and business stakeholders can undermine project success. Specialists may struggle to translate technical constraints into business terms or understand implicit requirements.
Training programs focused on business communication, stakeholder management, and domain knowledge help bridge these gaps. Pairing technical specialists with business analysts or project managers can provide communication support while skills develop.
Retention Strategy Development
Retention strategies become critical given the competitive market for visualization talent. High turnover rates disrupt project continuity and increase recruitment costs.
Effective retention strategies include competitive compensation, professional development opportunities, challenging project assignments, and clear career progression paths. Regular satisfaction surveys and exit interviews provide insights into improvement opportunities.
Onboarding Process Optimization
Onboarding process optimization accelerates time-to-productivity for new hires while improving early-stage satisfaction. Comprehensive onboarding programs should cover technical systems, business context, and team dynamics.
Structured mentoring programs, gradual responsibility increases, and regular check-ins help new team members integrate successfully. Investment in onboarding infrastructure pays dividends through improved retention and faster contribution to team objectives.
Future-Proofing Your Visualization Talent
The rapidly evolving landscape of data visualization requires proactive talent development strategies. Organizations must balance current project needs with preparation for emerging technologies and methodologies.
AI-Augmented Visualization Skills
AI-augmented visualization tools increasingly automate routine tasks while enabling more sophisticated analytical capabilities. Specialists need skills in prompt engineering, AI tool integration, and quality assessment of automated outputs.
Training programs should cover both technical implementation and ethical considerations around AI-generated insights. Understanding AI limitations and potential biases becomes essential for maintaining analytical integrity.
Emerging Technology Training
Emerging technologies like augmented reality, virtual reality, and voice interfaces create new visualization opportunities. Early investment in these capabilities provides competitive advantages as adoption accelerates.
Experimental projects and innovation time allocation allow teams to explore new technologies without disrupting current operations. Partnerships with technology vendors often provide early access to development tools and training resources.
Continuous Learning Programs
Continuous learning programs ensure teams stay current with rapidly evolving tools and methodologies. Structured learning paths, certification programs, and conference attendance help maintain cutting-edge capabilities.
Learning programs should balance technical skills with soft skills development, including leadership, communication, and strategic thinking. Investment in continuous learning demonstrates organizational commitment to employee development.
Career Development Pathways
Clear career development pathways help retain talent while building organizational capabilities. Progression routes might include technical specialization, team leadership, client management, or strategic consulting roles.
Regular career discussions, skill gap assessments, and development planning help employees understand advancement opportunities. Mentoring programs and stretch assignments provide practical experience in new roles and responsibilities.