
I will help you to re-design your Power BI dashboardRohit Aagre
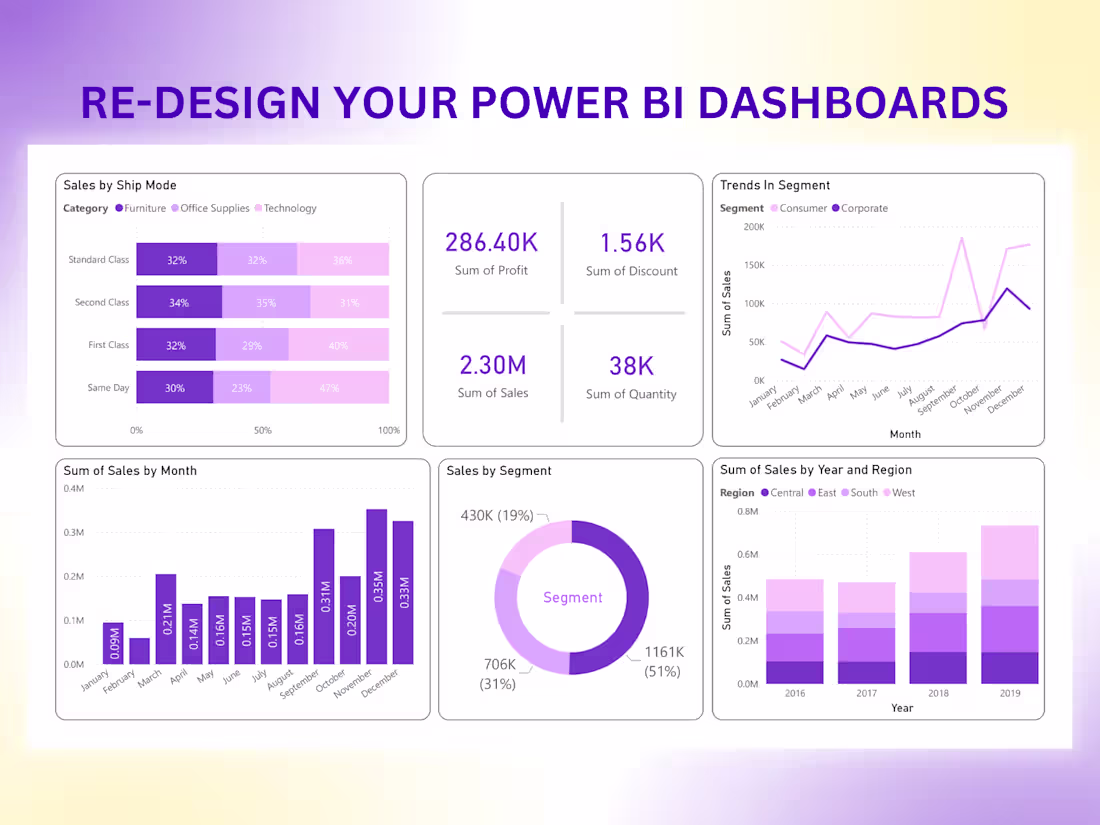
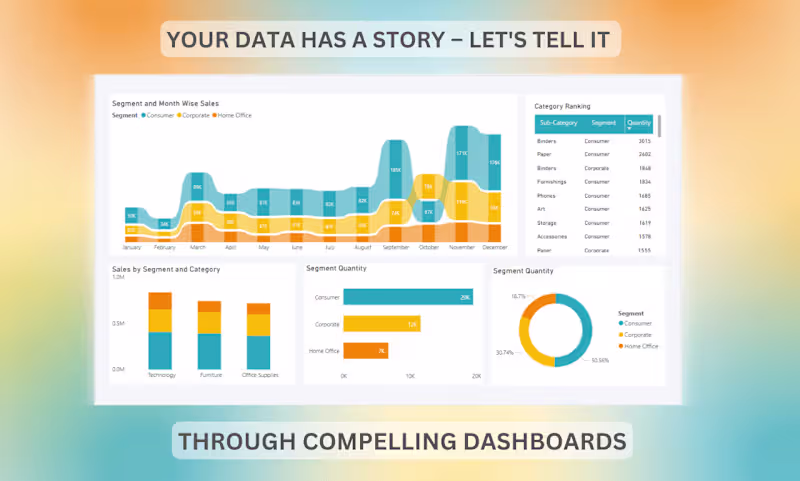
I will transform raw data into compelling stories. I will create or Re-design visually impactful dashboards using tools like Power BI, Tableau to translate complex information into easily understandable charts and graphs. Let me help you communicate your data-driven narrative effectively.
Tools I use in data analysis :
SQL, Excel, Power BI, Tableau, etc
Need help with your data? contact me today!
What's included
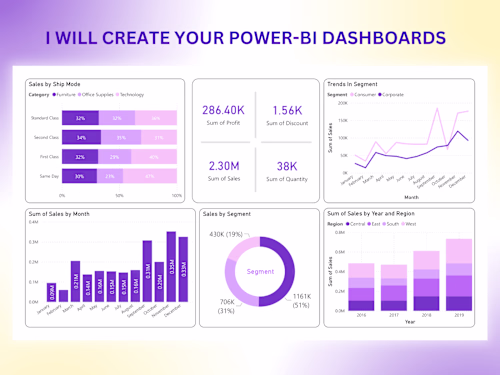
Redesigning Power BI Dashboards:
Creation of visually appealing and interactive Power BI dashboards tailored to the client's specific requirements.
Data Analysis Reports:
Preparation of comprehensive reports based on in-depth analysis of datasets, providing actionable insights.
Visualizations and Graphs:
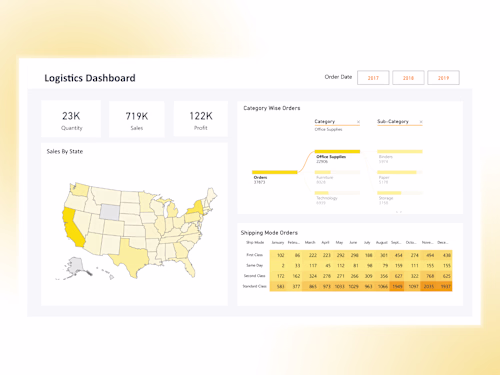
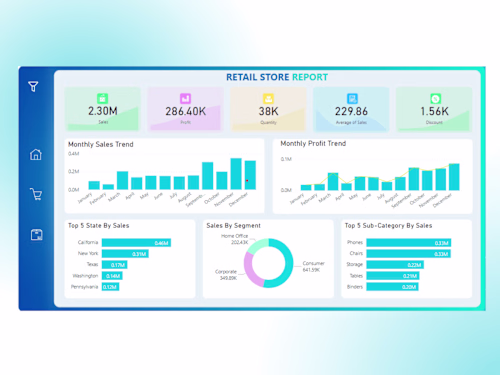
Creation of visual representations (charts, graphs) to effectively communicate analytical findings to stakeholders
Insights Interpretation:
Interpretation and explanation of analytical insights, making complex data understandable for non-technical stakeholders.
Rohit's other services
Contact for pricing
Tags
MySQL
Data Analyst
Database Specialist
Data Visualizer
Service provided by
Rohit Aagre Mumbai, India
I will help you to re-design your Power BI dashboardRohit Aagre
Contact for pricing
Tags
MySQL
Data Analyst
Database Specialist
Data Visualizer
I will transform raw data into compelling stories. I will create or Re-design visually impactful dashboards using tools like Power BI, Tableau to translate complex information into easily understandable charts and graphs. Let me help you communicate your data-driven narrative effectively.
Tools I use in data analysis :
SQL, Excel, Power BI, Tableau, etc
Need help with your data? contact me today!
What's included
Redesigning Power BI Dashboards:
Creation of visually appealing and interactive Power BI dashboards tailored to the client's specific requirements.
Data Analysis Reports:
Preparation of comprehensive reports based on in-depth analysis of datasets, providing actionable insights.
Visualizations and Graphs:
Creation of visual representations (charts, graphs) to effectively communicate analytical findings to stakeholders
Insights Interpretation:
Interpretation and explanation of analytical insights, making complex data understandable for non-technical stakeholders.
Rohit's other services
Contact for pricing