
Diana O
Full-Stack Web Developer (Data Viz / Gen AI / Neo4j / Maps)
Ready for work
Diana is ready for their next project!
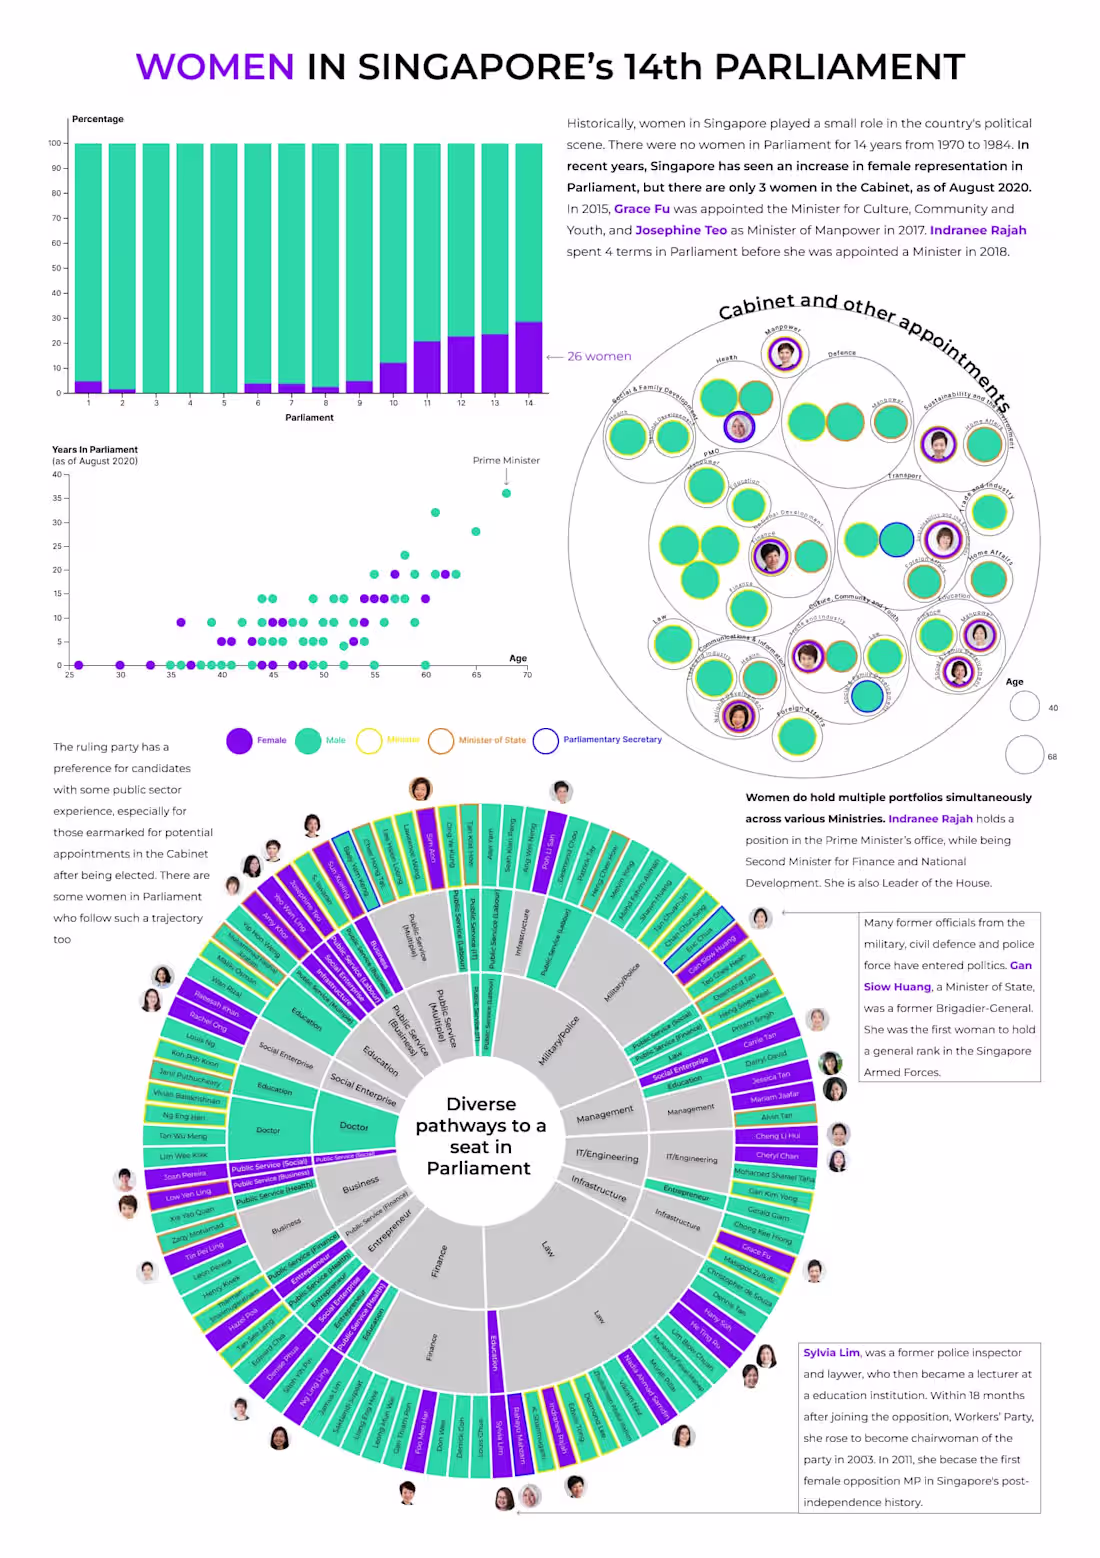
Women in Singapore's 14th Parliament
1
22
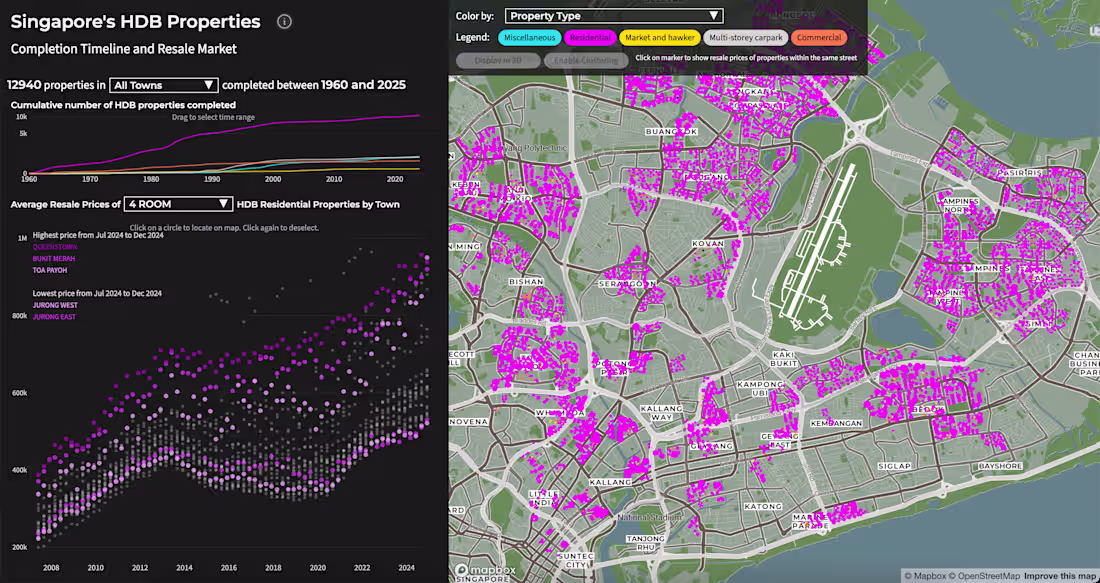
Public Housing Resale Prices in Singapore
0
28
D3.js: Scrollytelling Visual Article
1
19
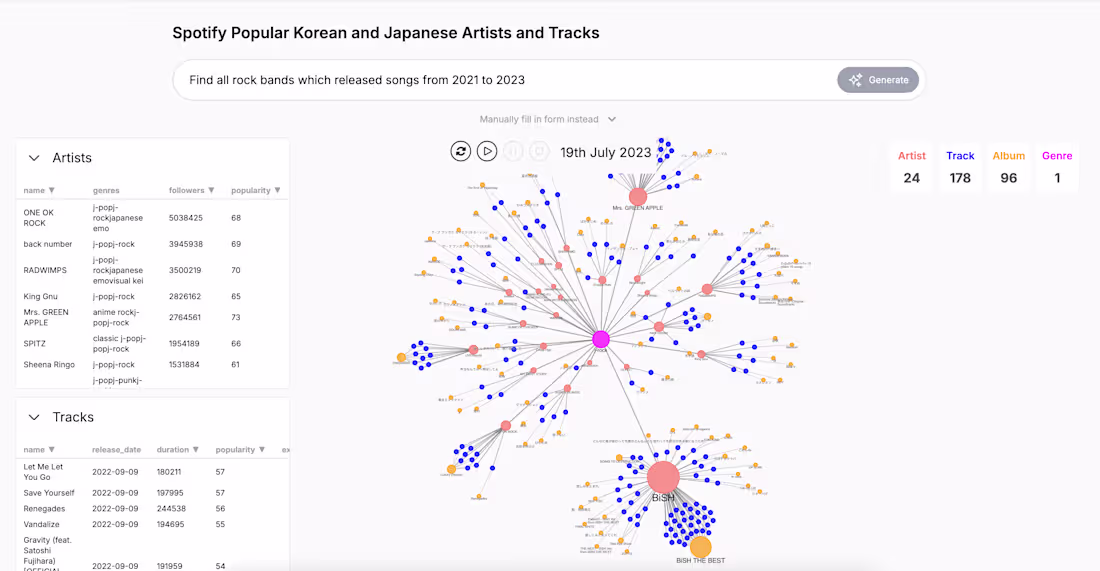
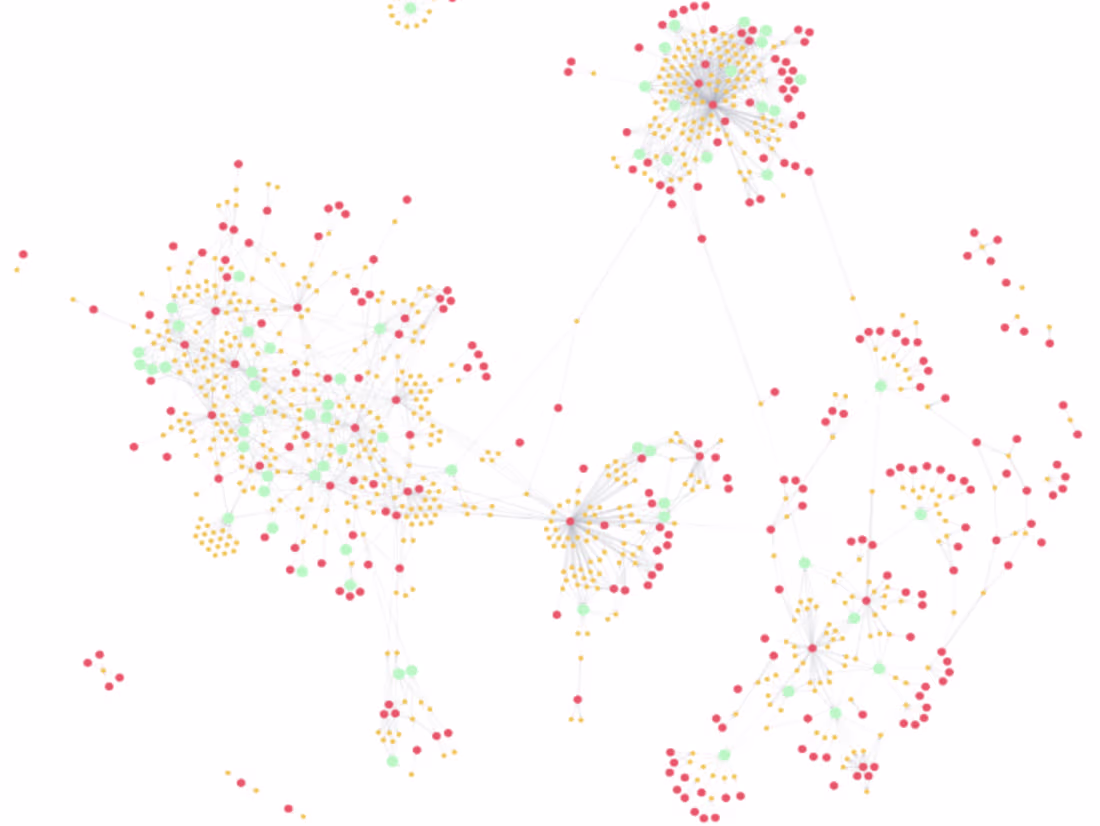
Next.js / D3js / Neo4j / OpenAI: Search Engine & Network Viz
0
41
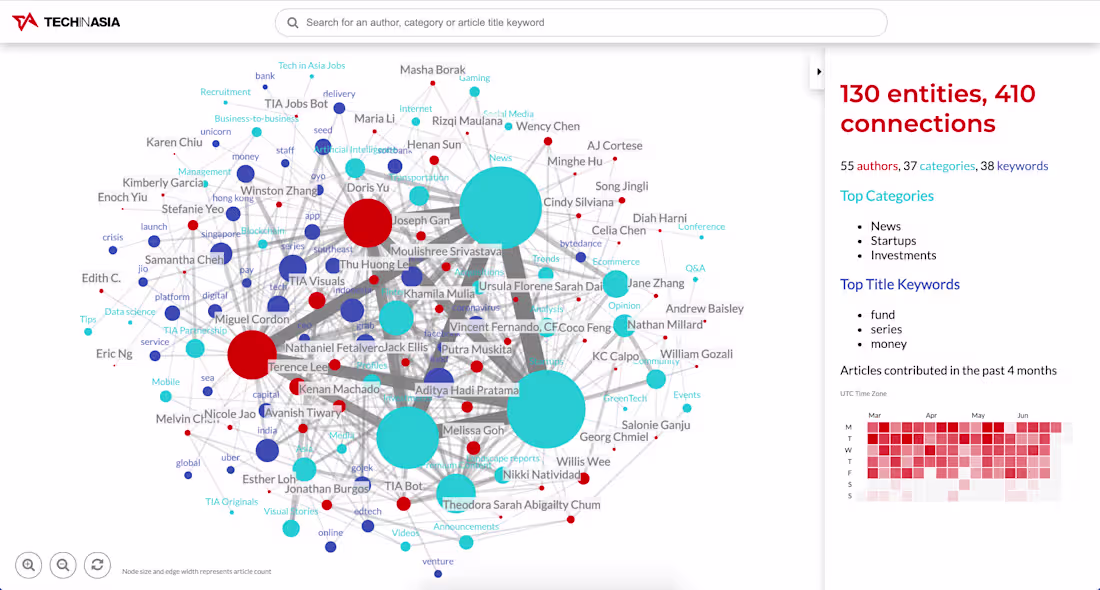
Tech in Asia Article Network: Exploring Authors & Topics
0
15
Data Engineering with Music Metadata: From API to Graph Insights
0
15
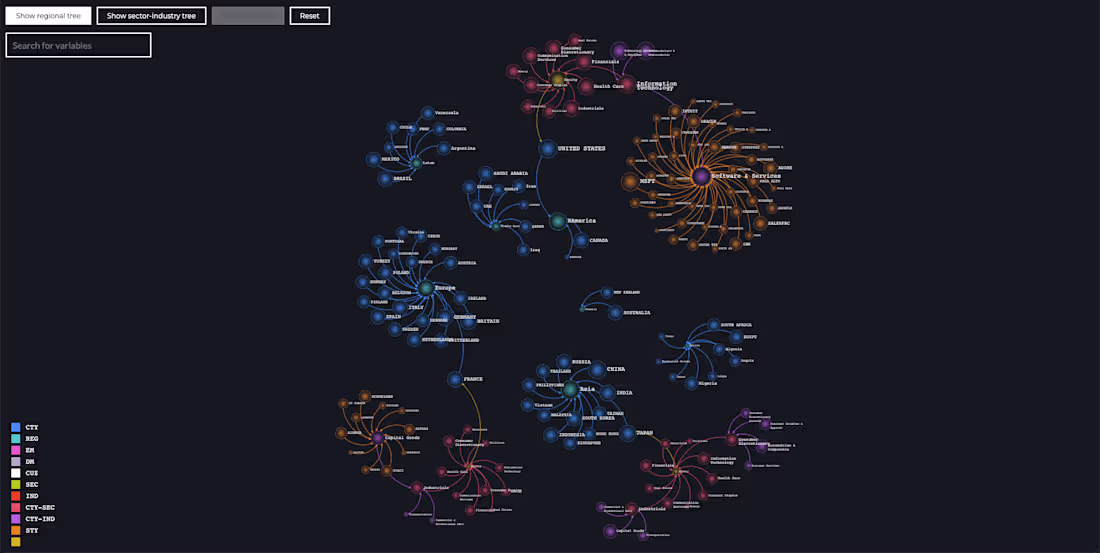
Financial Equities Network Diagram Prototype
0
8
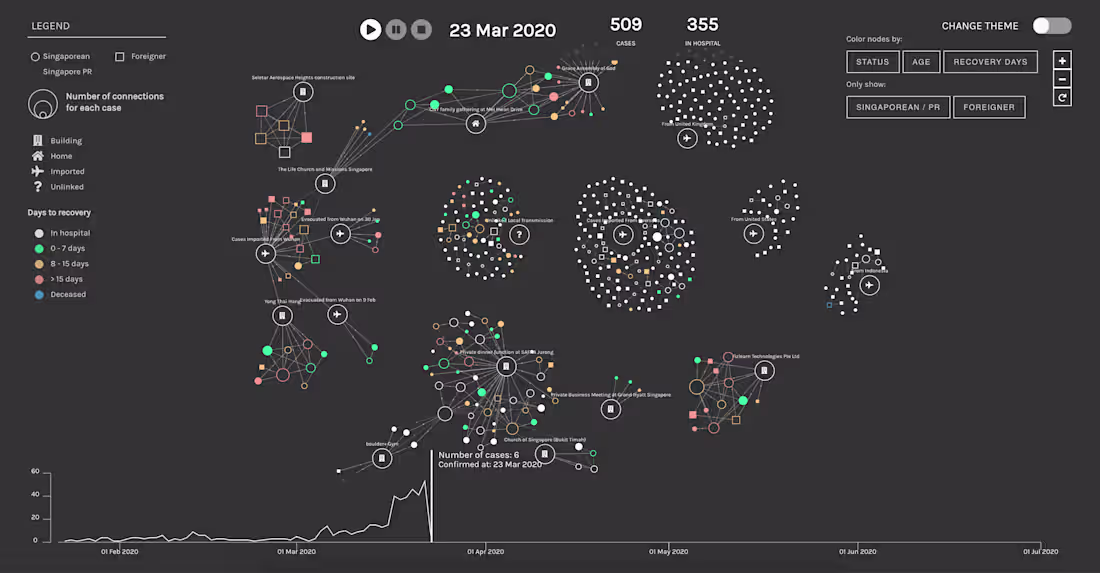
COVID-19 Case Visualization for Singapore
0
9
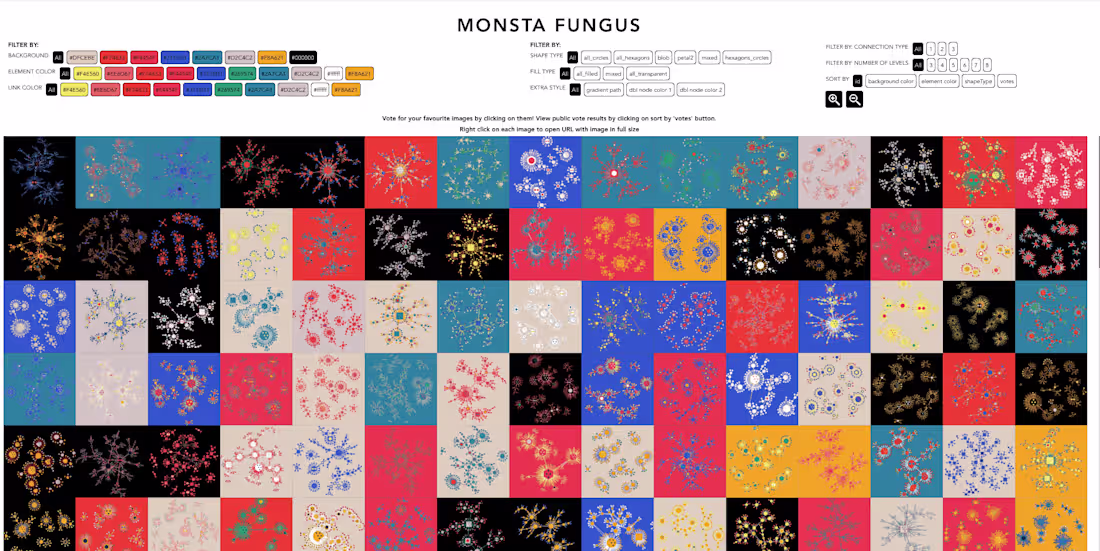
Interactive Digital Art Gallery
0
29
Scrollytelling Analysis of Singapore's 14th Parliament
1
10
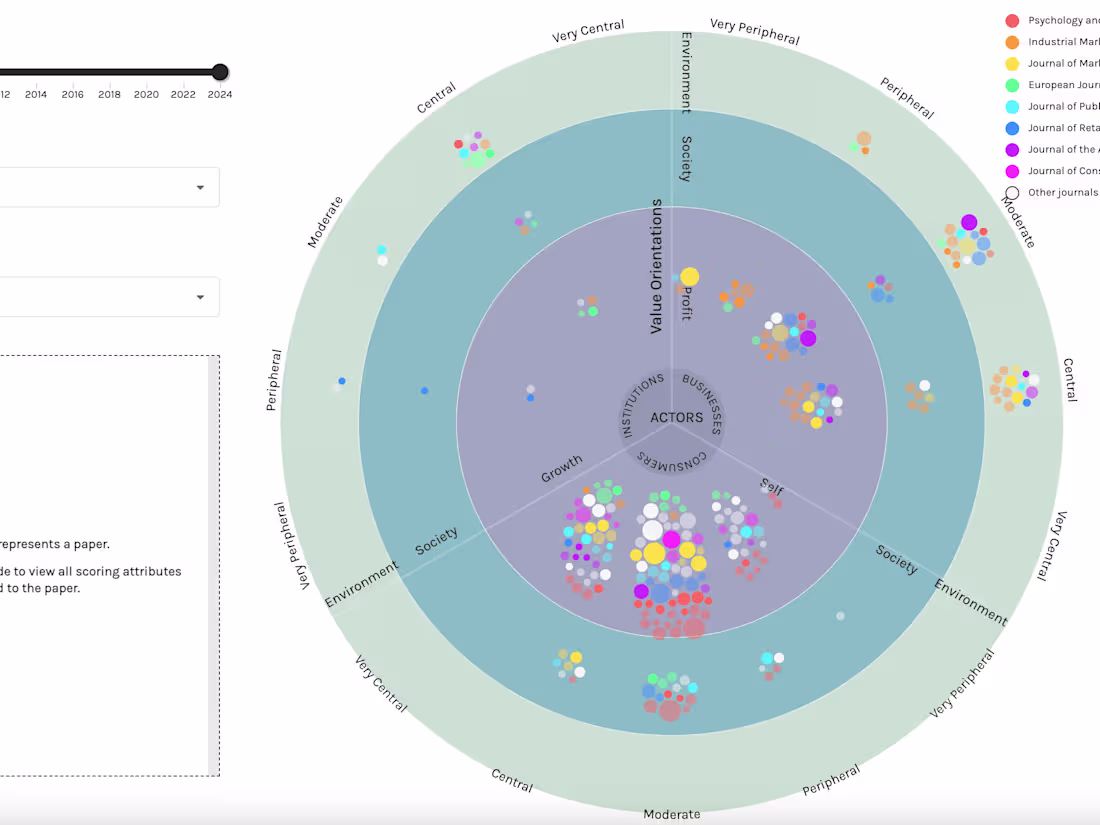
React / D3.js: Sustainability Research App
0
30
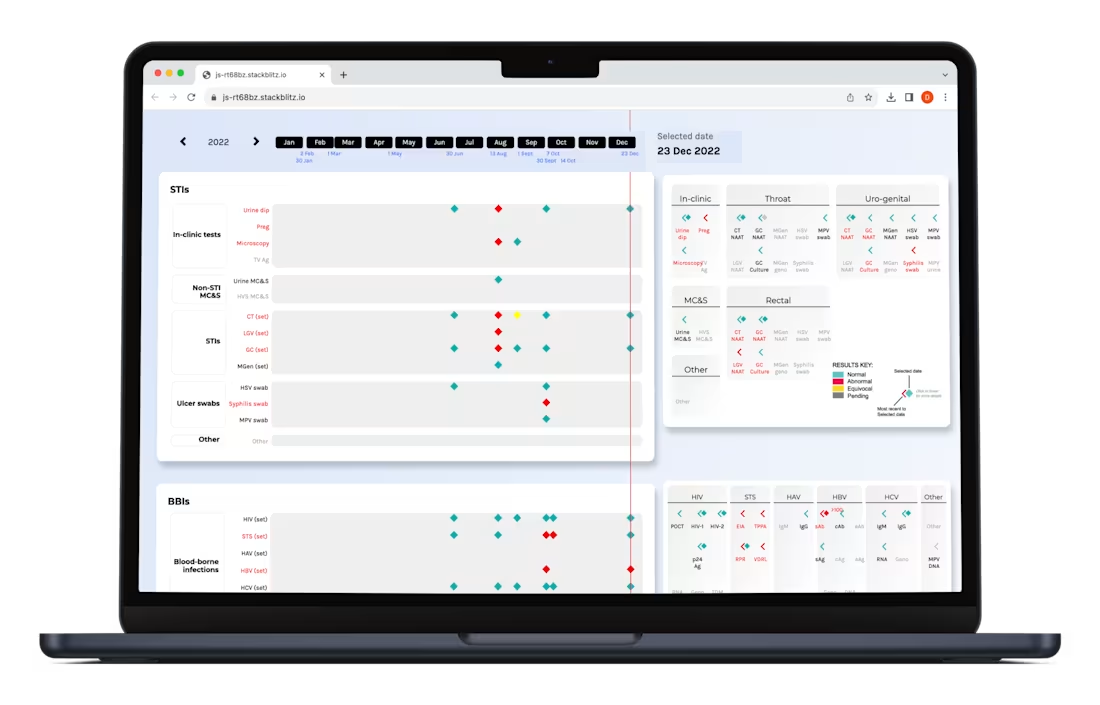
Web-based tool for monitoring medical data
0
41

Data visualization library for a healthcare technology company
0
33
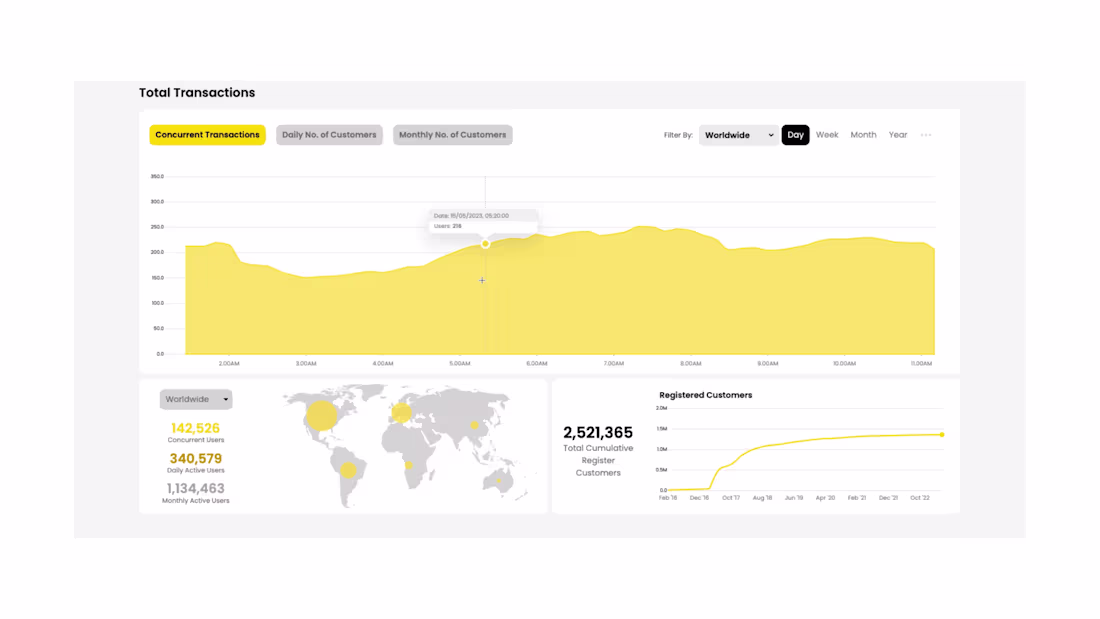
Web3 Gaming BI Dashboard
0
55