
Data Visualization Dashboard DevelopmentDiana O
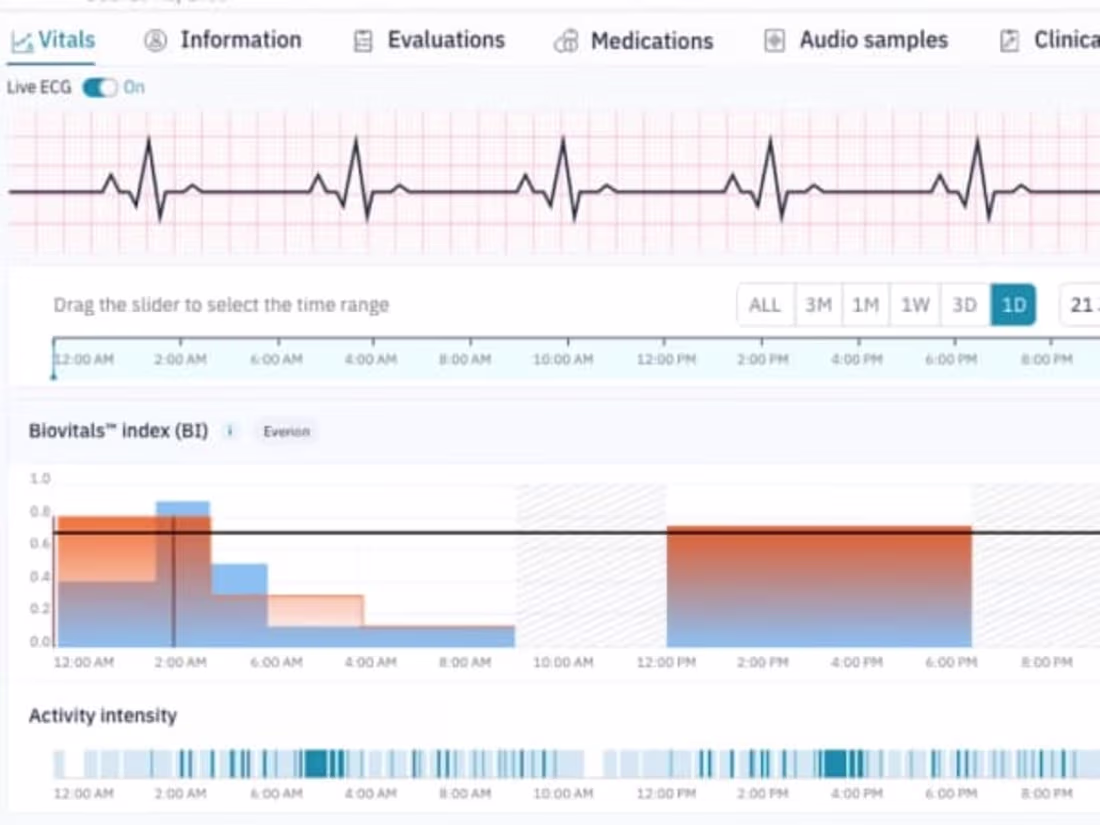
You will get a presentable, impactful and aesthetic web-based data dashboard that best represents the dataset, through careful analysis, design and development of visuals by me. Users are able to monitor key metrics, investigate outliers and compare data over time periods with ease.
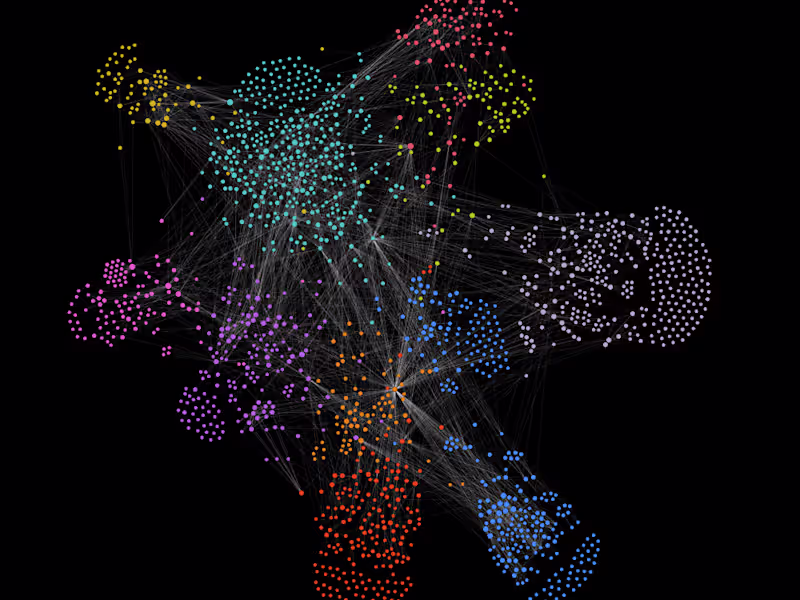
My main Javascript libraries of choice for rendering charts are D3.js, PIXI.js and Vega-lite. For building web applications, I have expertise in React and Svelte, with know-how on integrating charting libraries within them.
What's included
Data dashboard
A webpage containing customized and styled charts that best presents your data. Charts are programmed to be reusable and modularized components.
Interaction design and development
A panel of filters such as dropdowns, buttons or time slider to dissect data presented on the charts, to allow audiences to make their own investigations of particular data attributes and trends
Web responsiveness and performances
The data dashboard is responsive to various screen sizes. Data load and chart rendering time is fast to ensure a great user experience. Animations and mouse events are accurate and smooth.
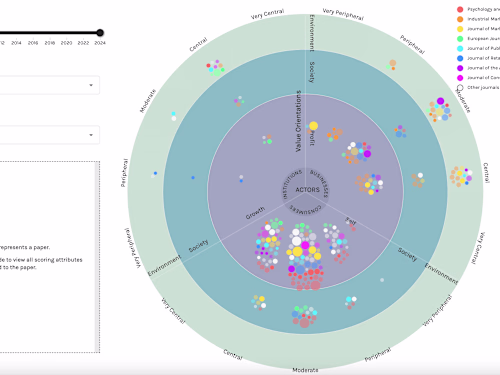
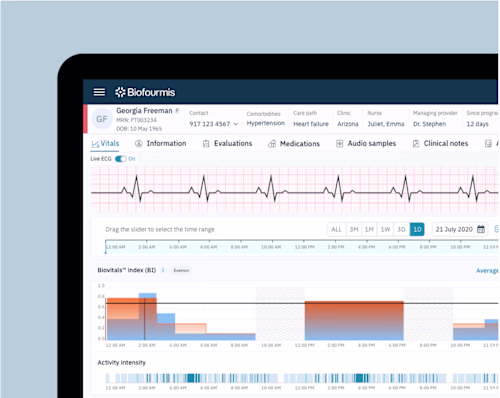
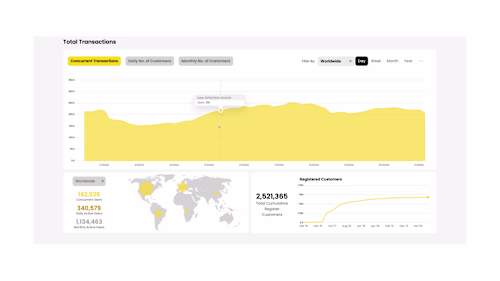
Example work
Diana's other services
Contact for pricing
Tags
D3.js
JavaScript
PixiJS
Svelte
Tailwind CSS
Data Visualizer
Frontend Engineer
Web Developer
Service provided by
Diana O Singapore
- 6
- Followers
Data Visualization Dashboard DevelopmentDiana O
Contact for pricing
Tags
D3.js
JavaScript
PixiJS
Svelte
Tailwind CSS
Data Visualizer
Frontend Engineer
Web Developer
You will get a presentable, impactful and aesthetic web-based data dashboard that best represents the dataset, through careful analysis, design and development of visuals by me. Users are able to monitor key metrics, investigate outliers and compare data over time periods with ease.
My main Javascript libraries of choice for rendering charts are D3.js, PIXI.js and Vega-lite. For building web applications, I have expertise in React and Svelte, with know-how on integrating charting libraries within them.
What's included
Data dashboard
A webpage containing customized and styled charts that best presents your data. Charts are programmed to be reusable and modularized components.
Interaction design and development
A panel of filters such as dropdowns, buttons or time slider to dissect data presented on the charts, to allow audiences to make their own investigations of particular data attributes and trends
Web responsiveness and performances
The data dashboard is responsive to various screen sizes. Data load and chart rendering time is fast to ensure a great user experience. Animations and mouse events are accurate and smooth.
Example work
Diana's other services
Contact for pricing