React / D3.js: Sustainability Research App
Diana O
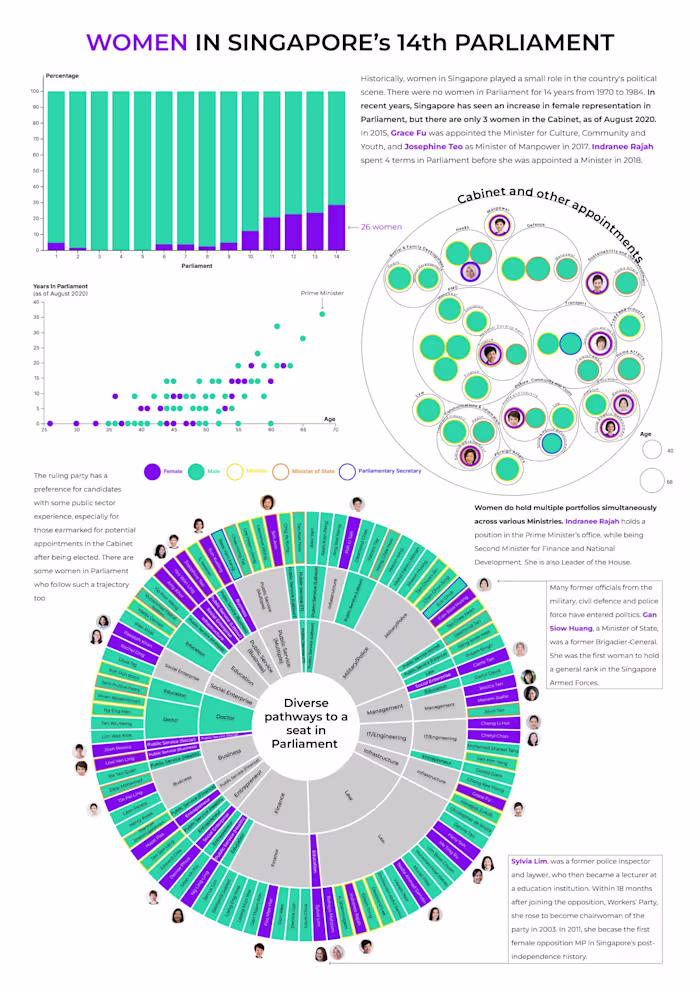
I built a web application for an academic research project. There are two goals to this interactive website, both built around a novel 'radial scatterplot'. Firstly, it enables users to identify trends and gaps through filtering by various aspects (Year, Author, Journal Type, Dimensions) so as to visually understand the research better. Secondly, users should be able to answer an embedded survey to place their own work/ideas on the Research Map.
Live site: https://avosp.vercel.app/
Blog post: https://dianaow.com/posts/react-data-dashboard
Like this project
Posted Aug 30, 2023
Created a novel, filterable and interactive circular Research Map to display high-dimensional data from academic research findings. Built with React and D3.js.