Data Visualization
Jon Retizos
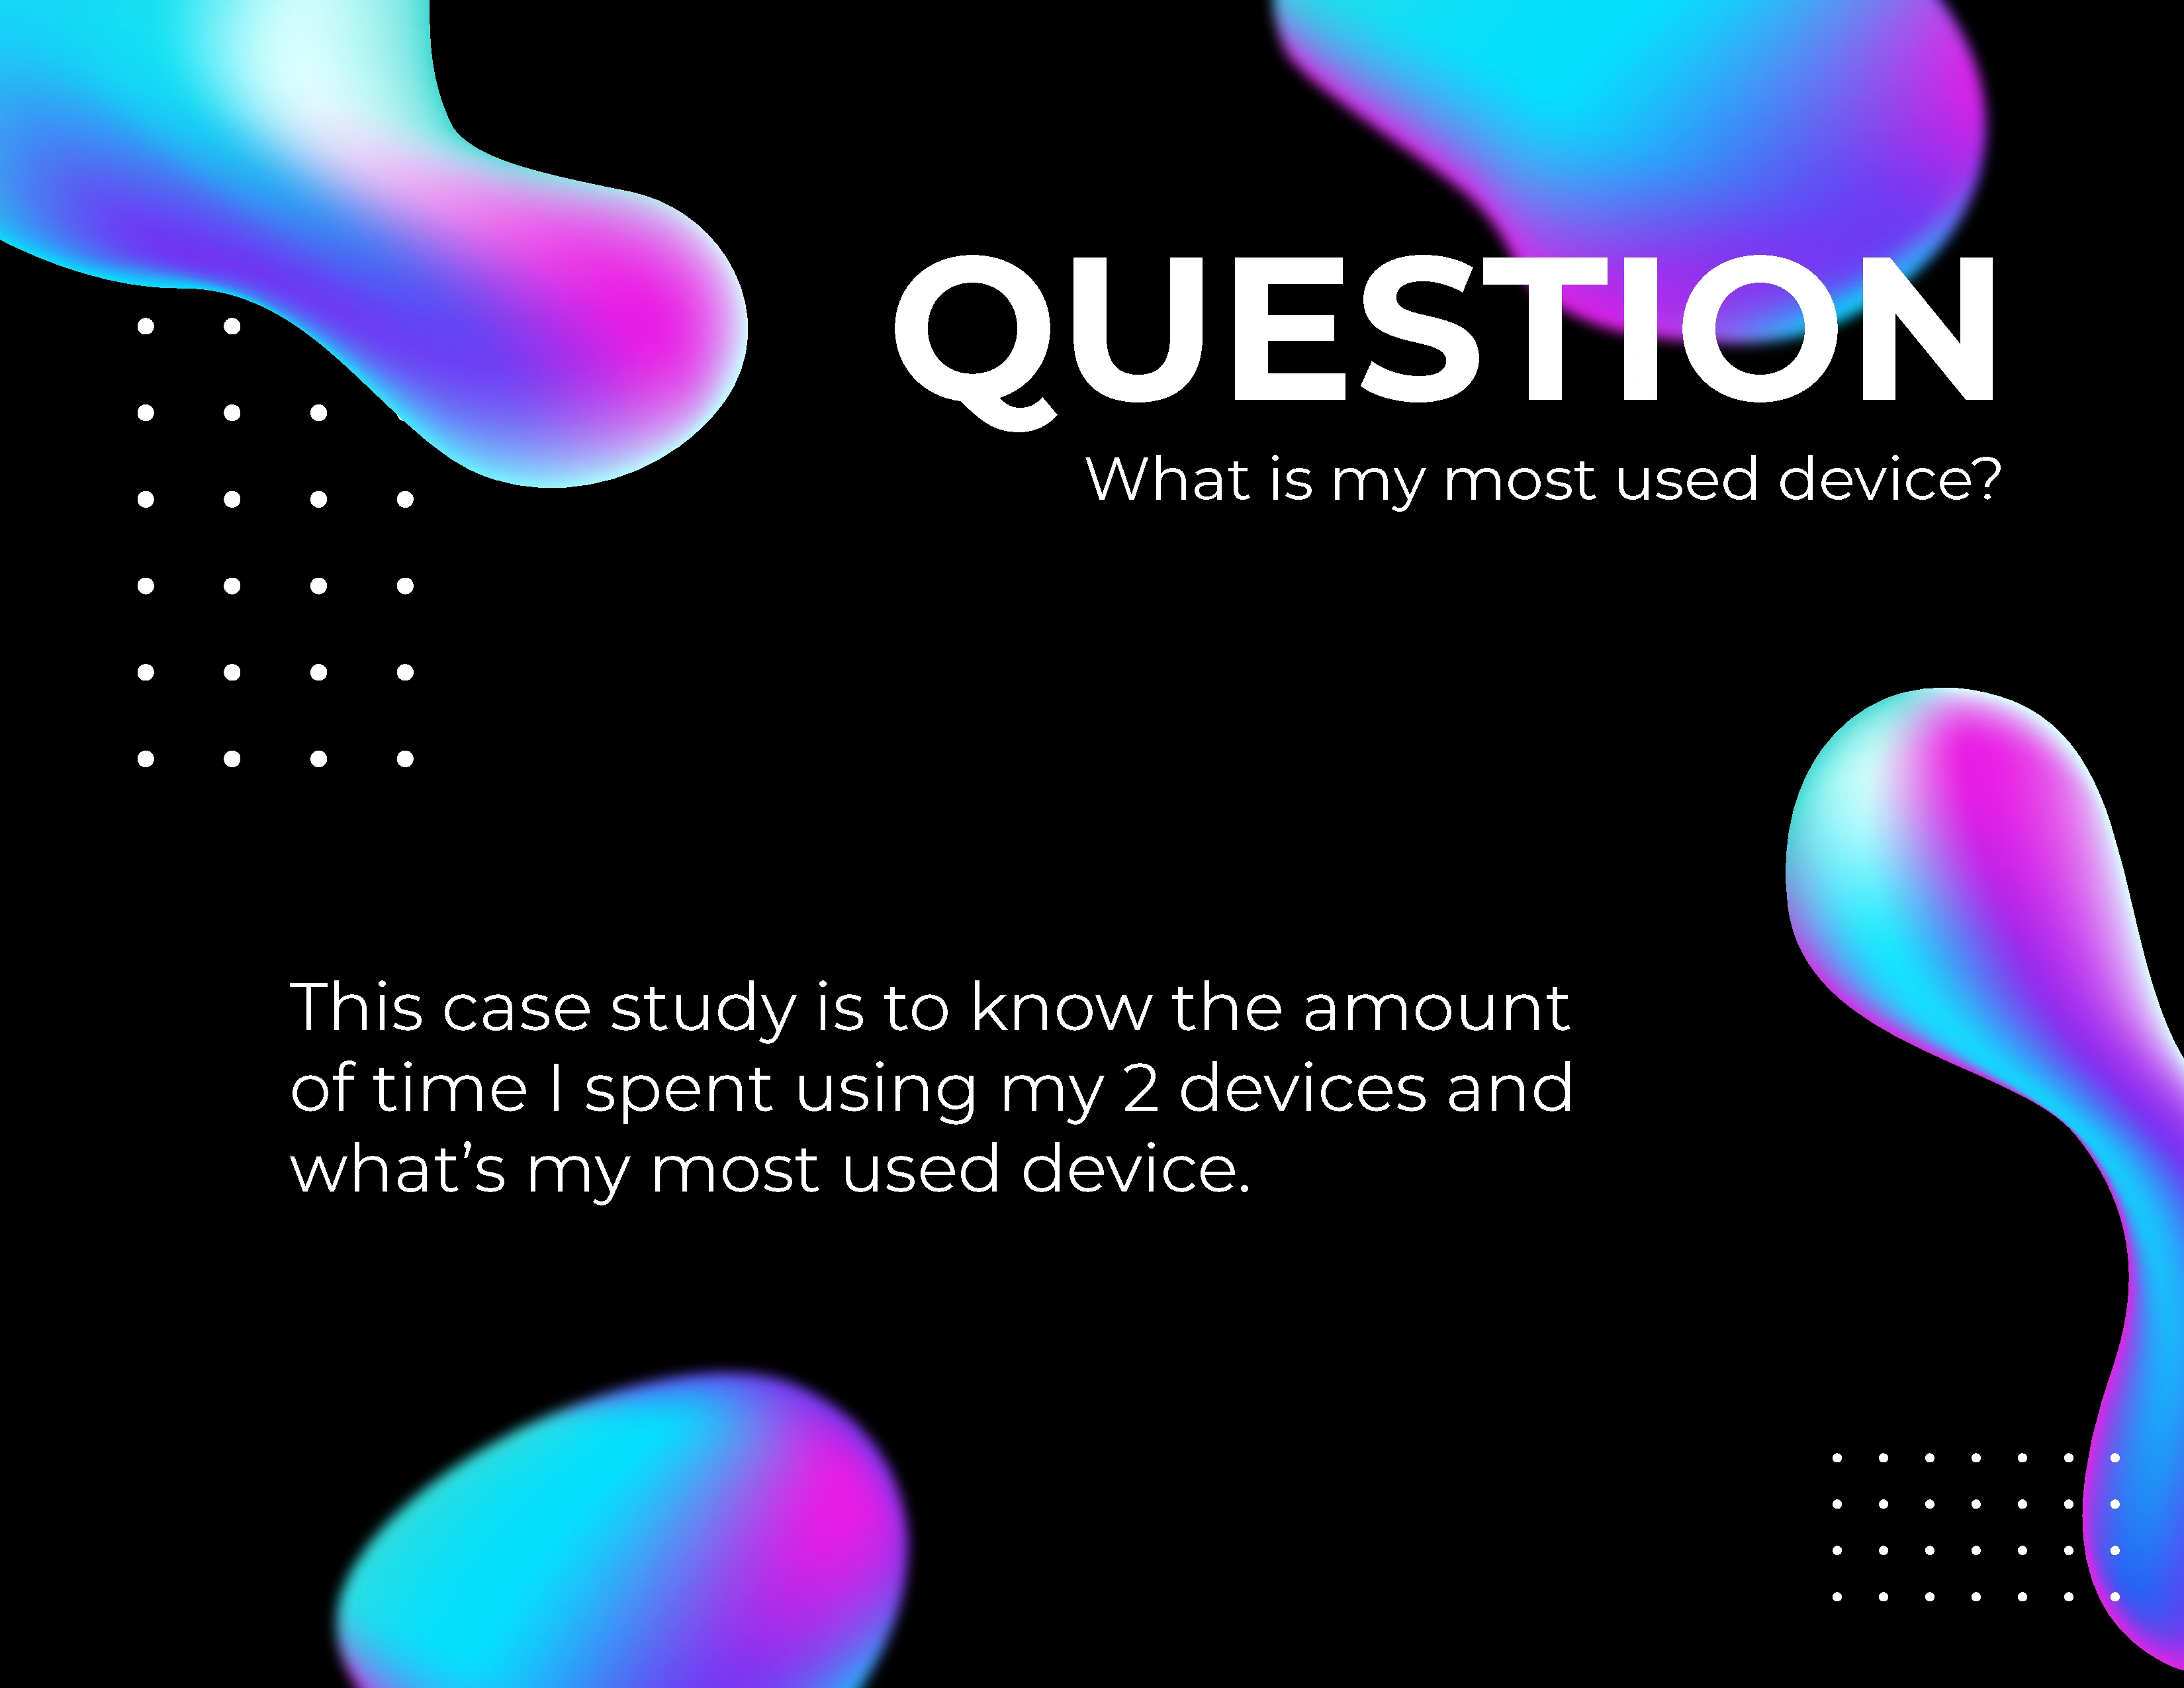
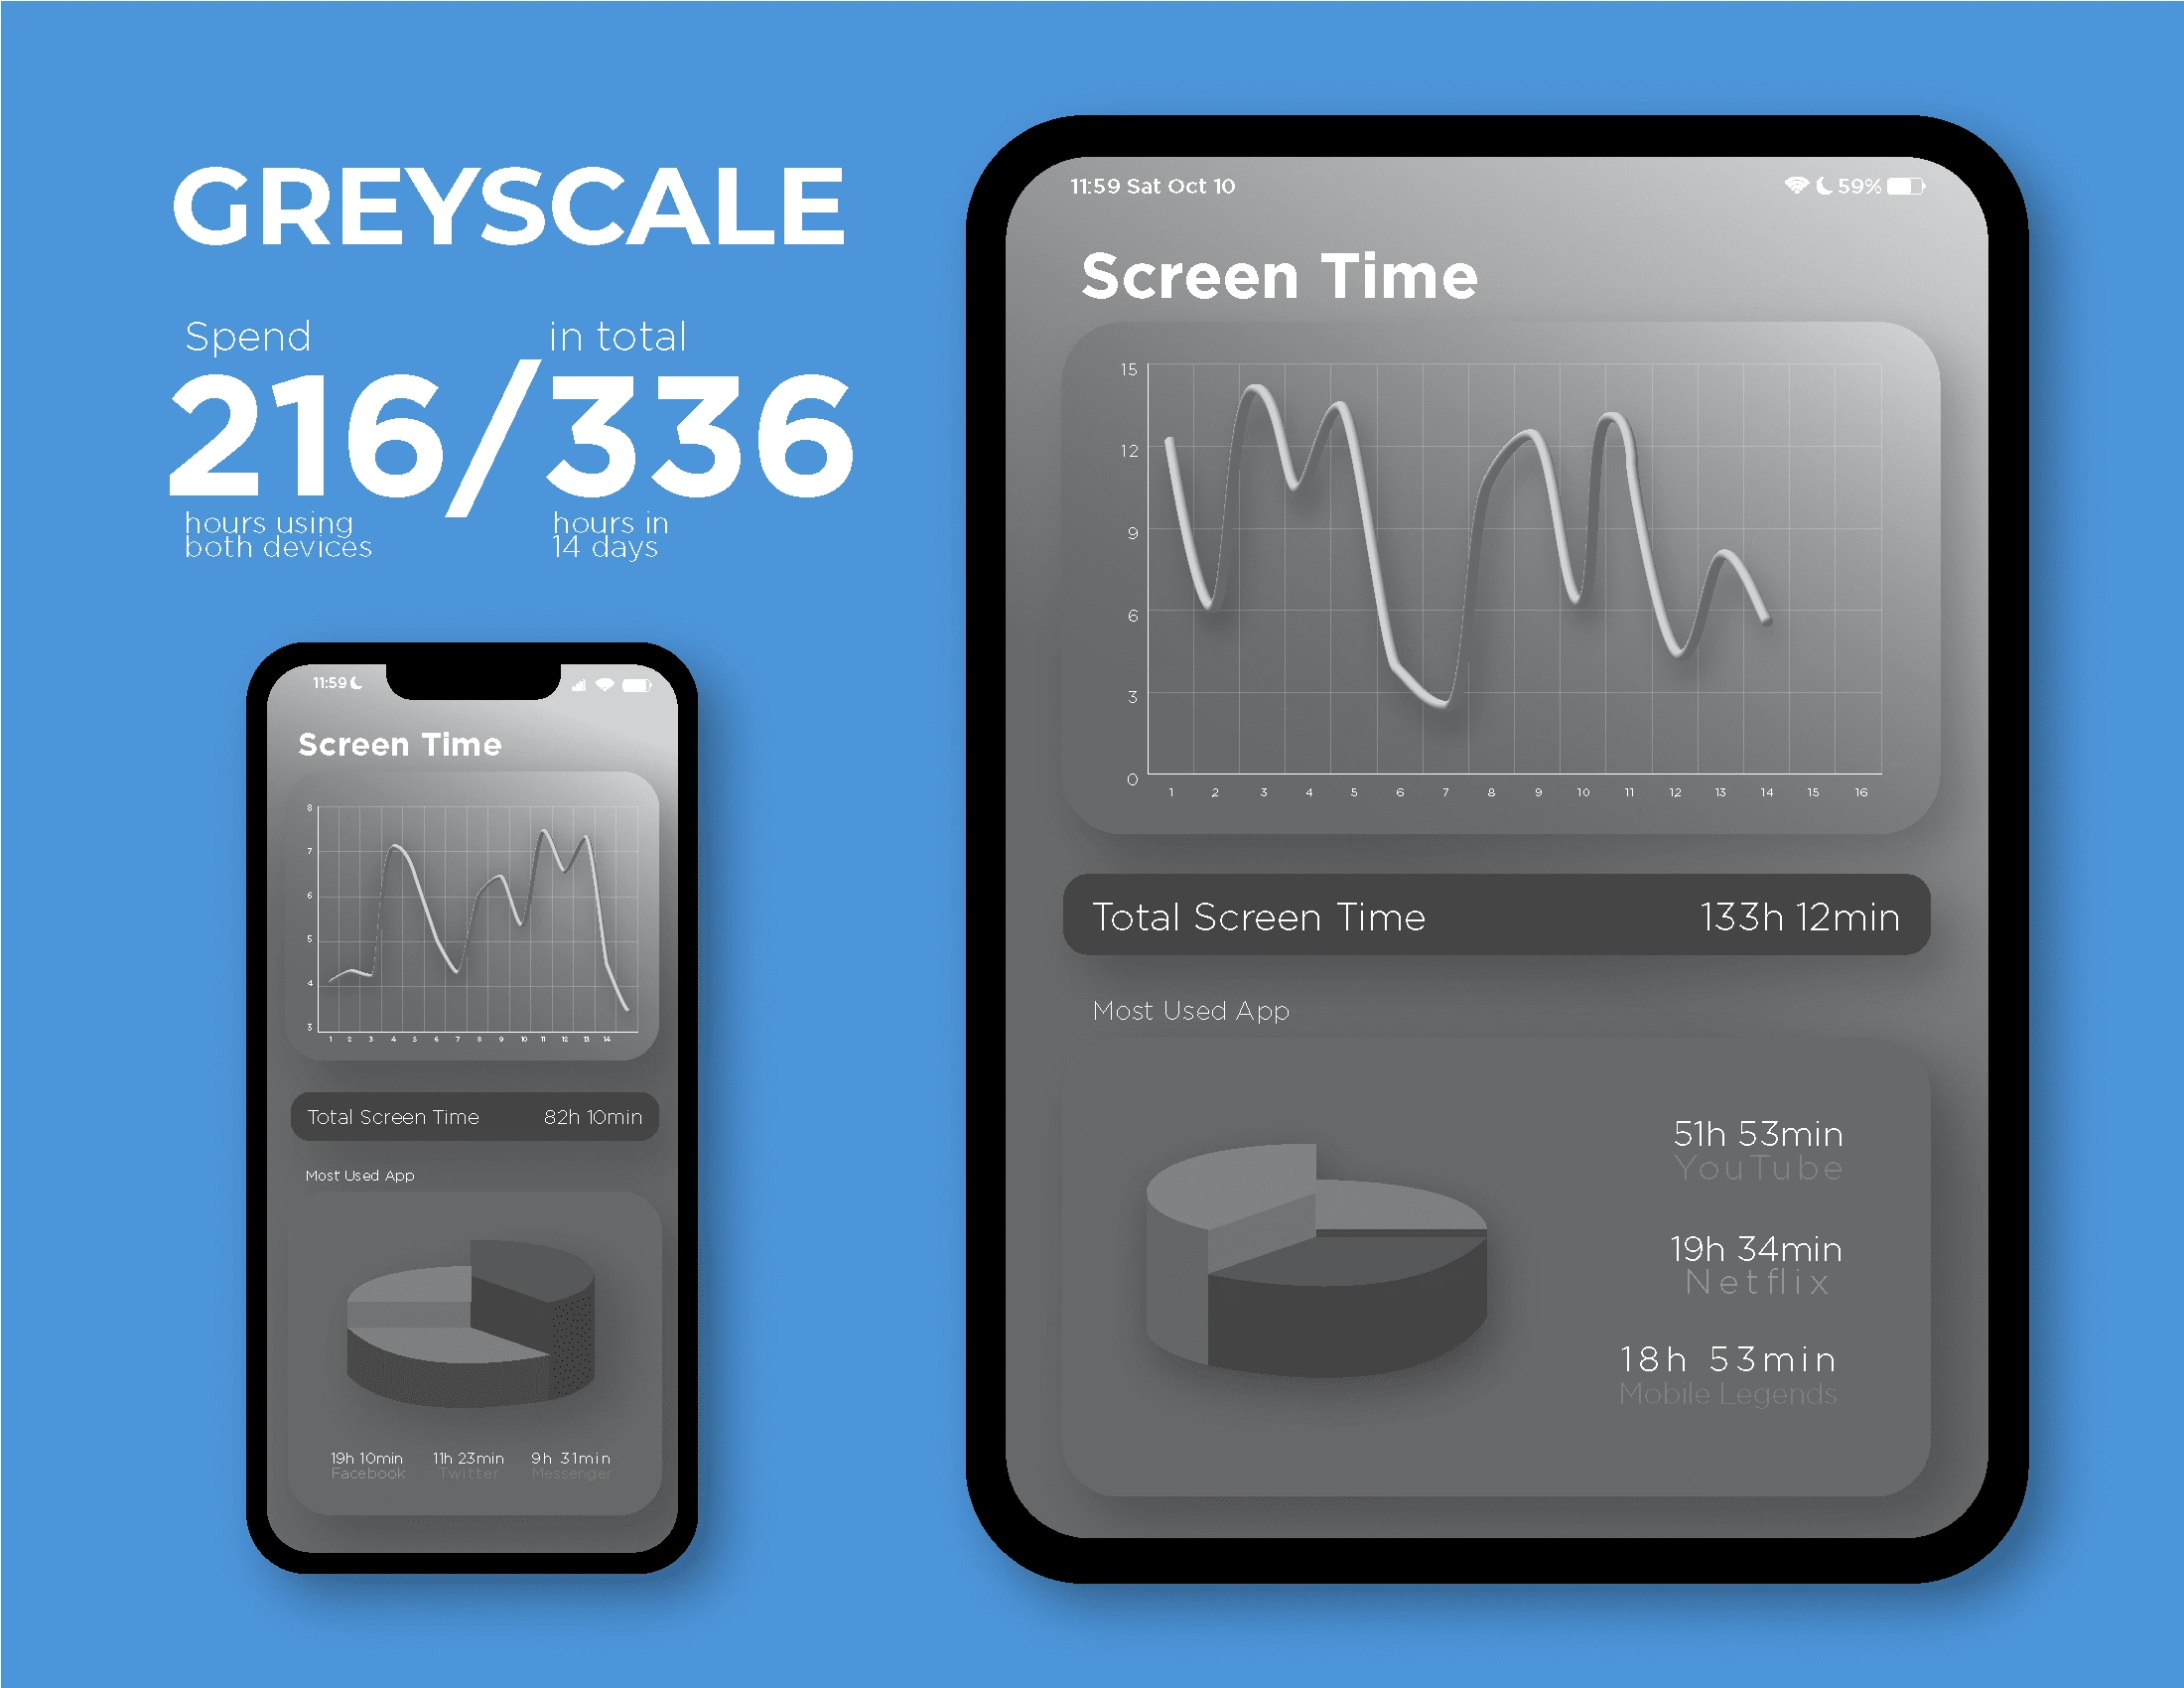
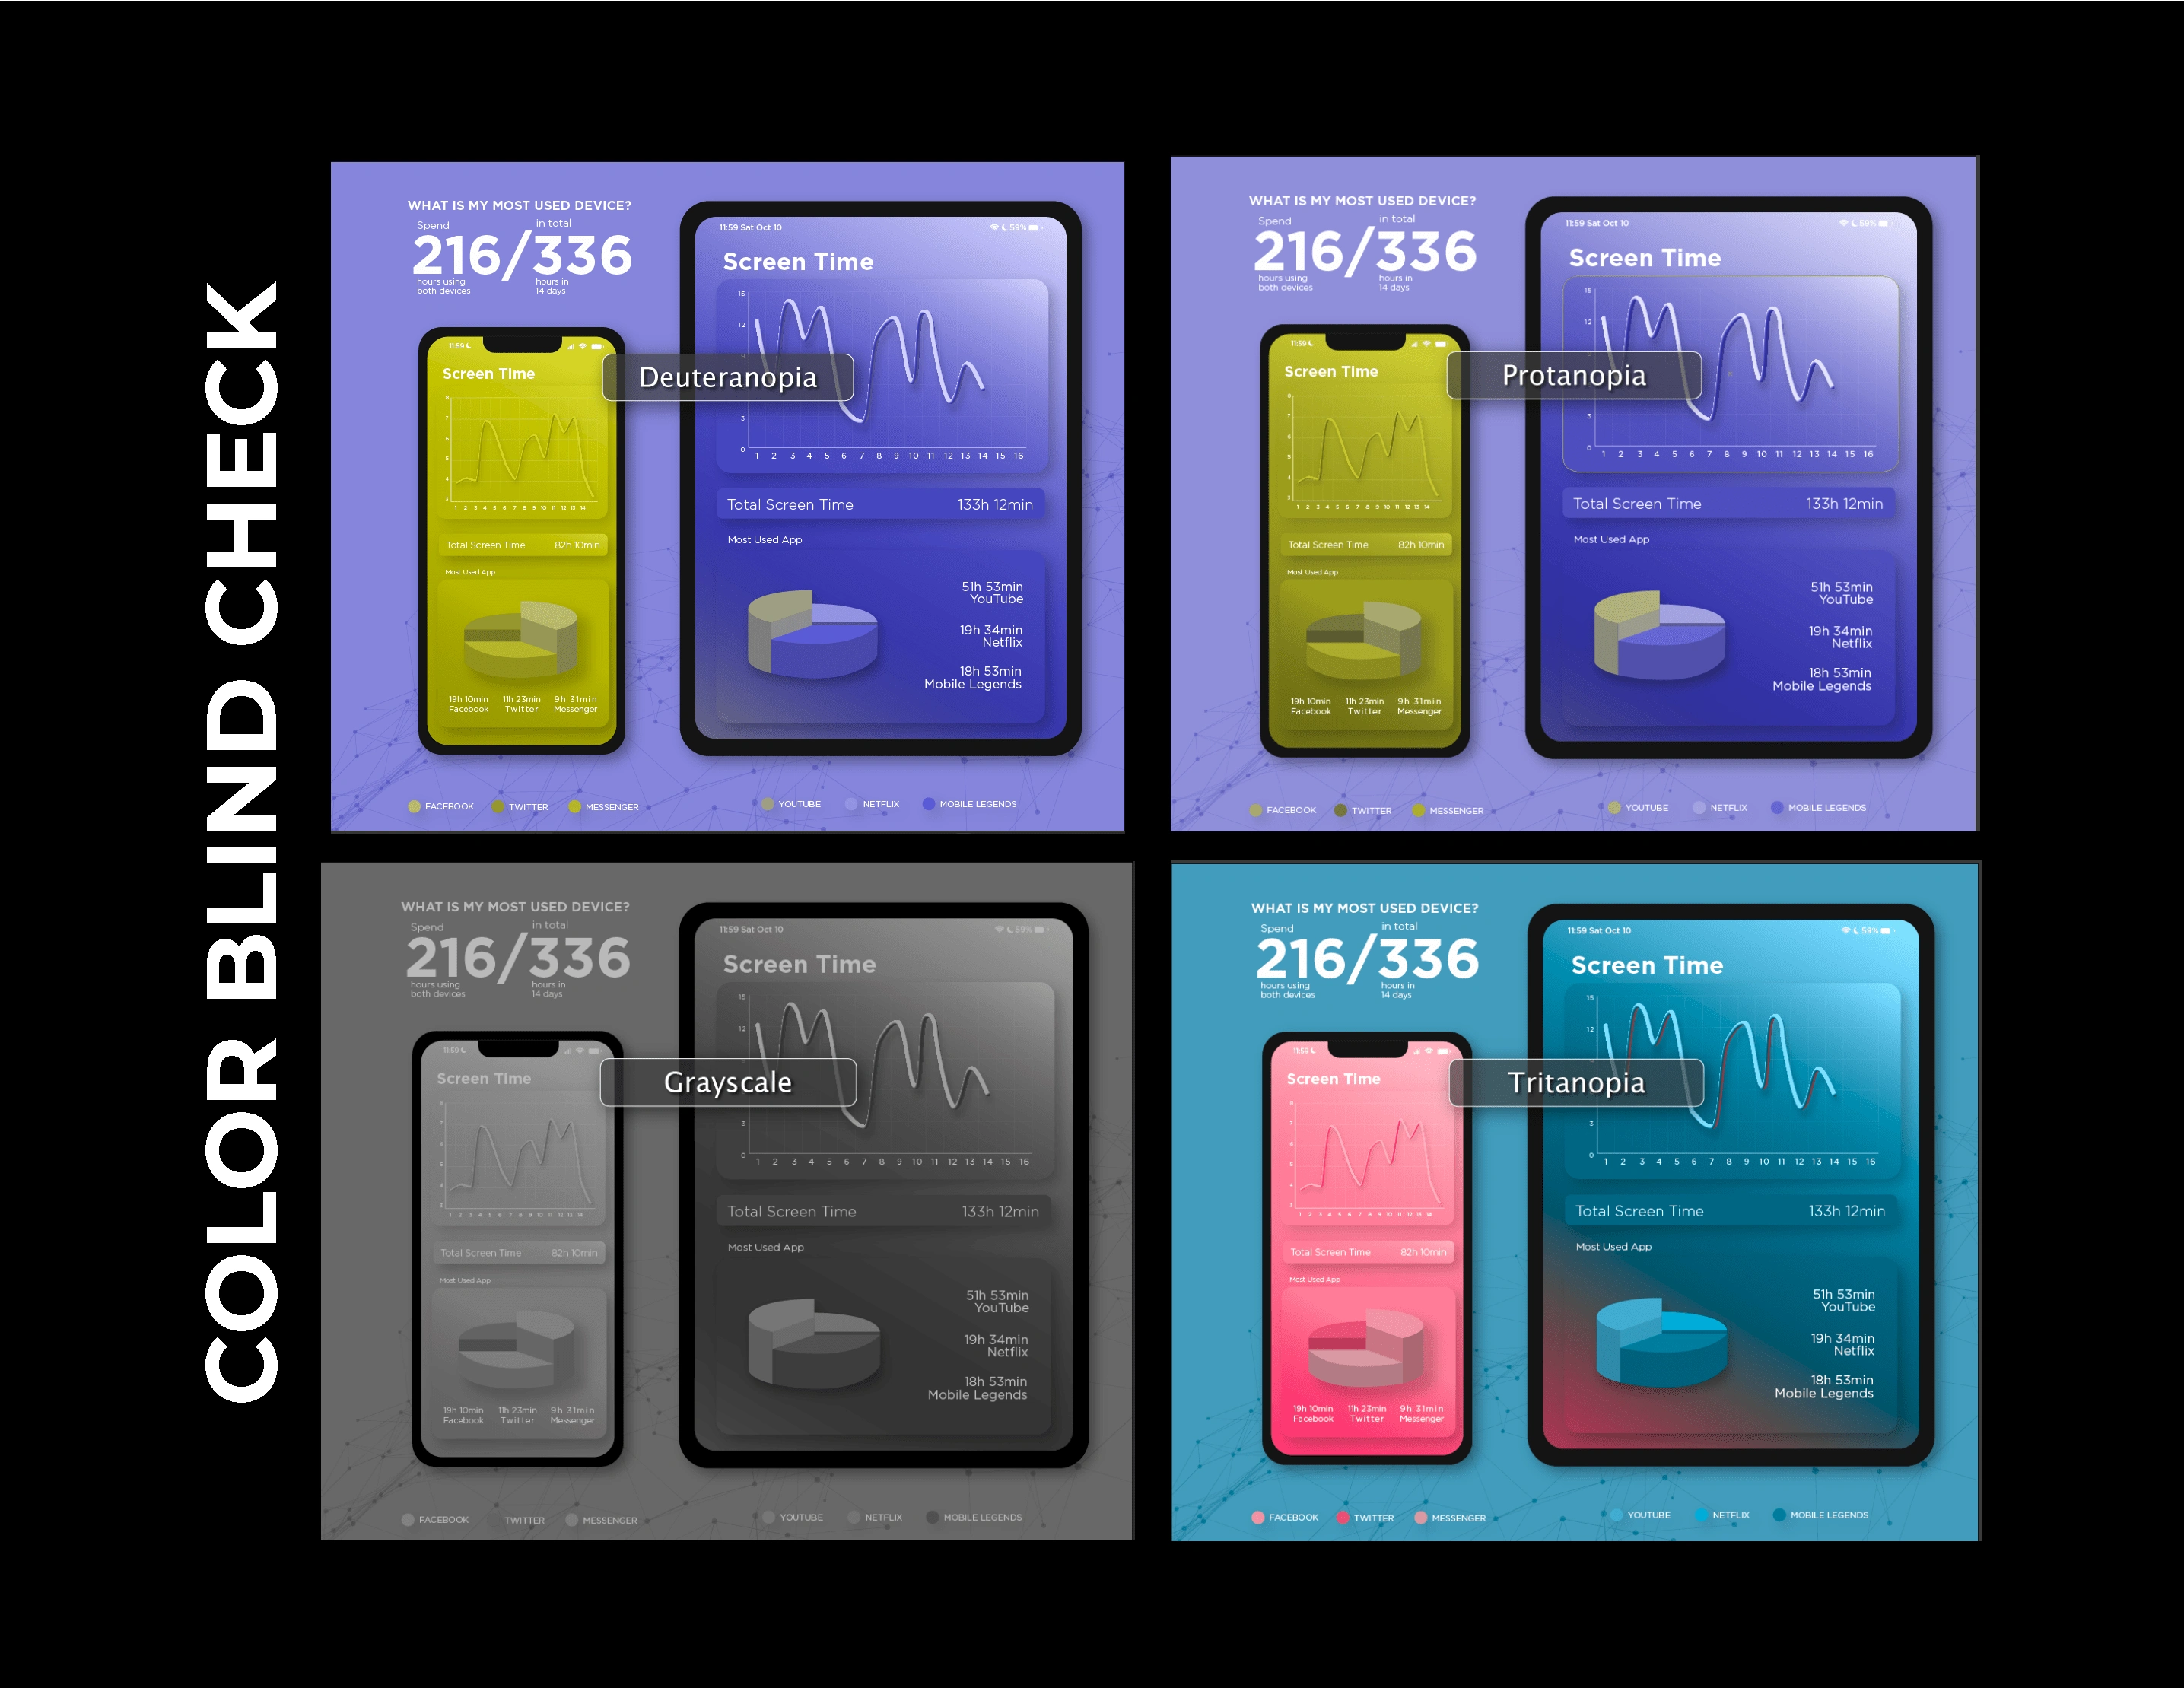
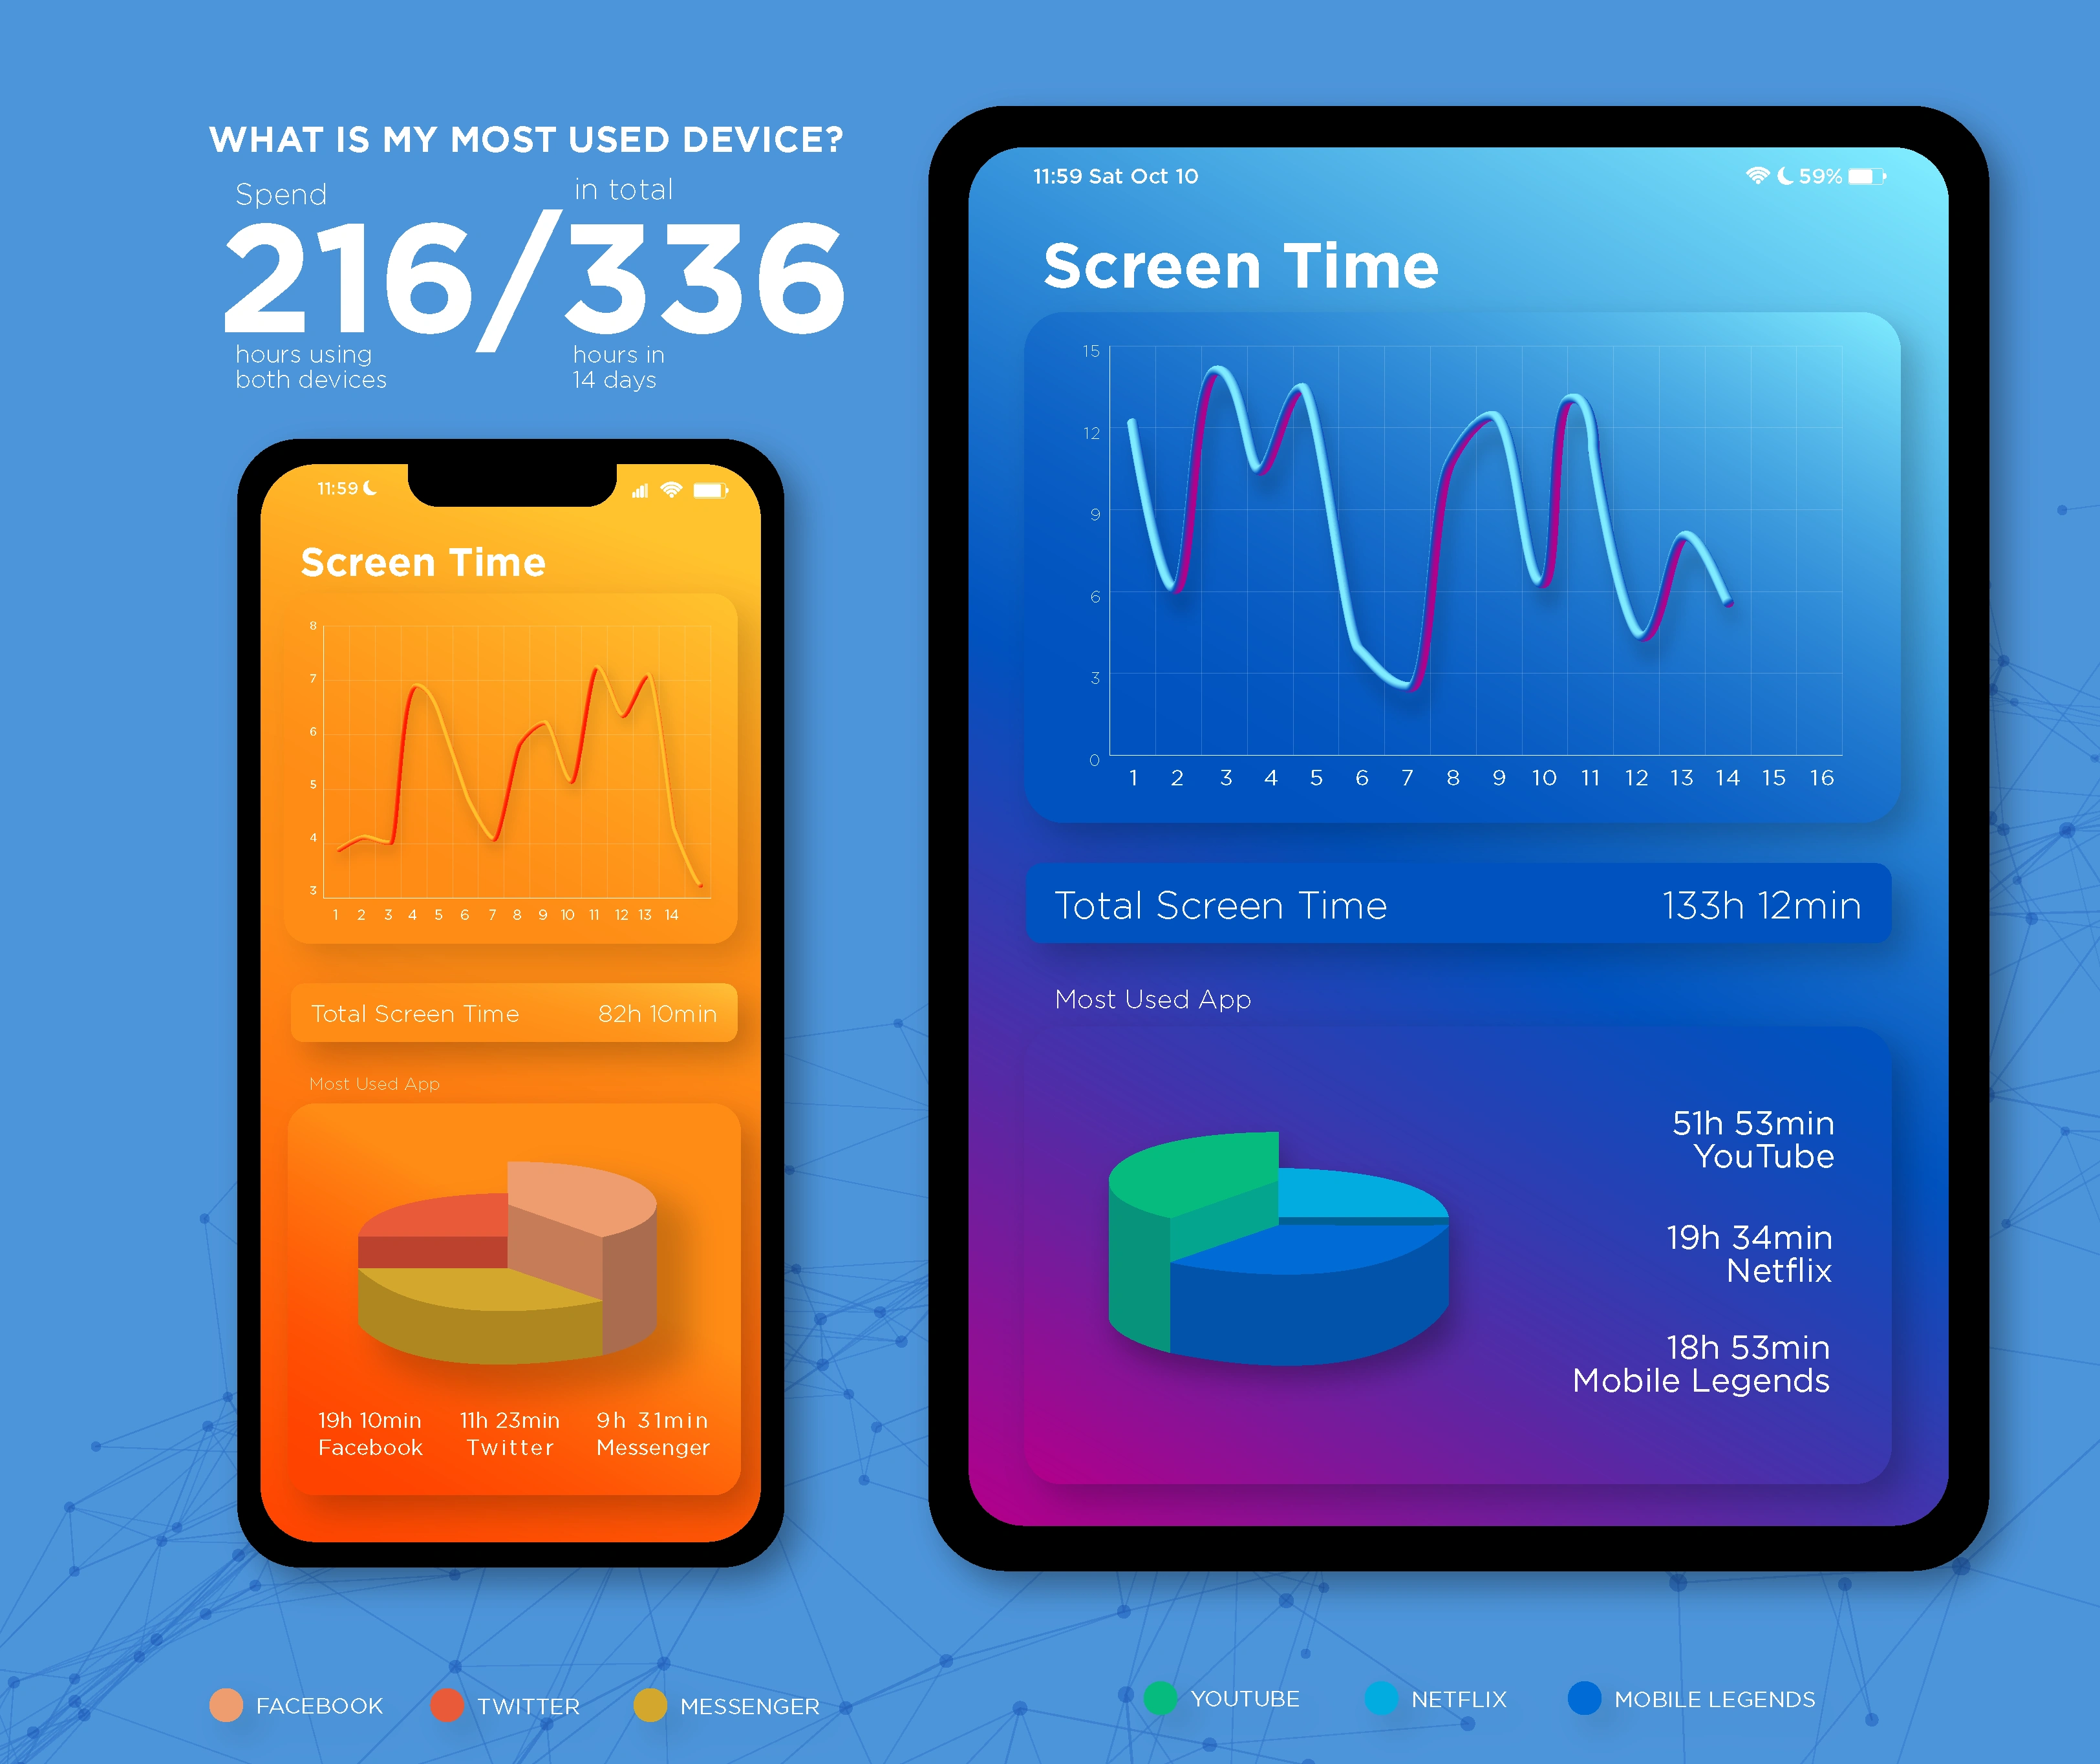
This data visualization provides a clear and comprehensive overview of my device usage habits, highlighting the amount of time I spent using my devices and which device I used the most. The visualization is presented in a visually appealing and easy-to-understand format, making it easy to grasp the key insights quickly.
Like this project
Posted Aug 10, 2023
Visualizes my device usage patterns, showing time spent and primary device. Simple, engaging format for quick insight absorption.
Likes
0
Views
37