Sales Insights Dashboard
Ravi chandu Edru
Sales Insights Dashboard
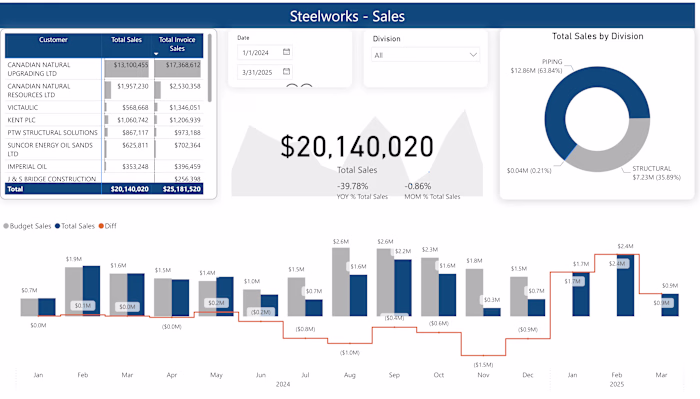
The "Sales Insights Dashboard" project aims to build a comprehensive, interactive Power BI dashboard that visualizes a company's sales data, providing key insights to help drive business decisions. The dashboard will be a central hub for stakeholders to monitor performance, analyze trends, and make data-driven decisions.
Key Objectives:
- Aggregate Sales Data: Consolidate sales data from multiple sources.
- Visualize Key Metrics: Present important sales metrics in an easily digestible format.
- Identify Trends: Highlight sales trends and patterns over various time periods.
- Enable Data Exploration: Allow users to drill down into details and perform ad-hoc analysis.
Core Features:
1. Sales Summary:
- Summary of total sales, broken down by day, week, month, and year.
- Comparative analysis with previous periods to track growth or decline.
2. Regional Sales Performance:
- Visualization of sales performance across different regions.
- Heatmaps or choropleth maps to identify high and low performing areas.
3. Product Analytics:
- Identification of top-selling and underperforming products.
- Performance metrics for different product categories.
4. Time Series Analysis:
- Line charts or trend lines showing sales progression over months, quarters, and years.
- Seasonal and cyclic trends analysis.
5. Customer Segmentation:
- Breakdowns of sales by different customer segments (e.g., new vs. repeat customers).
- Insights into customer demographics and purchasing behavior.
6. Key Sales Metrics:
- Display of important KPIs such as revenue, profit margins, average order value, and customer acquisition costs.
- Gauges or cards for at-a-glance performance checks.
Data Sources and Integration:
- Sales Transactions: Data from POS systems, e-commerce platforms, or CRM systems.
- Customer Information: Detailed customer profiles including demographic data.
- Product Details: Inventory and product categorization data from ERP or inventory systems.
- Geospatial Data: Information about sales regions and territories.
Development Phases:
1. Data Gathering:
- Collect and integrate data from various internal and external sources.
- Ensure data quality, consistency, and completeness.
2. Data Preparation:
- Use Power Query to clean, transform, and shape data into a usable format.
- Establish relationships between different datasets through data modeling.
3. Building and Designing:
- Create interactive and intuitive visualizations in Power BI.
- Use varied visualization tools (charts, graphs, maps) to present data effectively.
4. Publishing and Deployment:
- Deploy the dashboard on Power BI Service for easy access and sharing.
- Schedule data refreshes to keep the dashboard updated with the latest information.
5. User Training and Feedback:
- Conduct training sessions for end-users to ensure they can effectively interact with and interpret the dashboard.
- Gather feedback for continuous improvement and refinements.
Expected Outcomes:
- Enhanced Decision-Making: Provide actionable insights to improve strategic and tactical decisions.
- Performance Monitoring: Continuously track sales performance against targets.
- Trend Identification: Quickly identify emerging sales trends and respond accordingly.
- Customer Insights: Gain a deeper understanding of customer behaviors and preferences.
- Optimization Opportunities: Identify areas for improvement in sales strategies and operations.
Like this project
Posted Aug 2, 2024
Create an interactive Power BI "Sales Insights Dashboard" to visualize key sales metrics, identify trends, analyze regional performance, and provide actionable