Insights Suite - Resource utilization analysis tool
Ekta Bhoraniya
Insights Suite: Resource Utilization Analysis Tool
Enterprise Dashboard Redesign | 2024
Project Overview
As the sole product designer for this project, I transformed an internal resource utilization tool into a client-ready product with significantly improved user experience, resulting in better adoption, increased productivity, and new business opportunities.
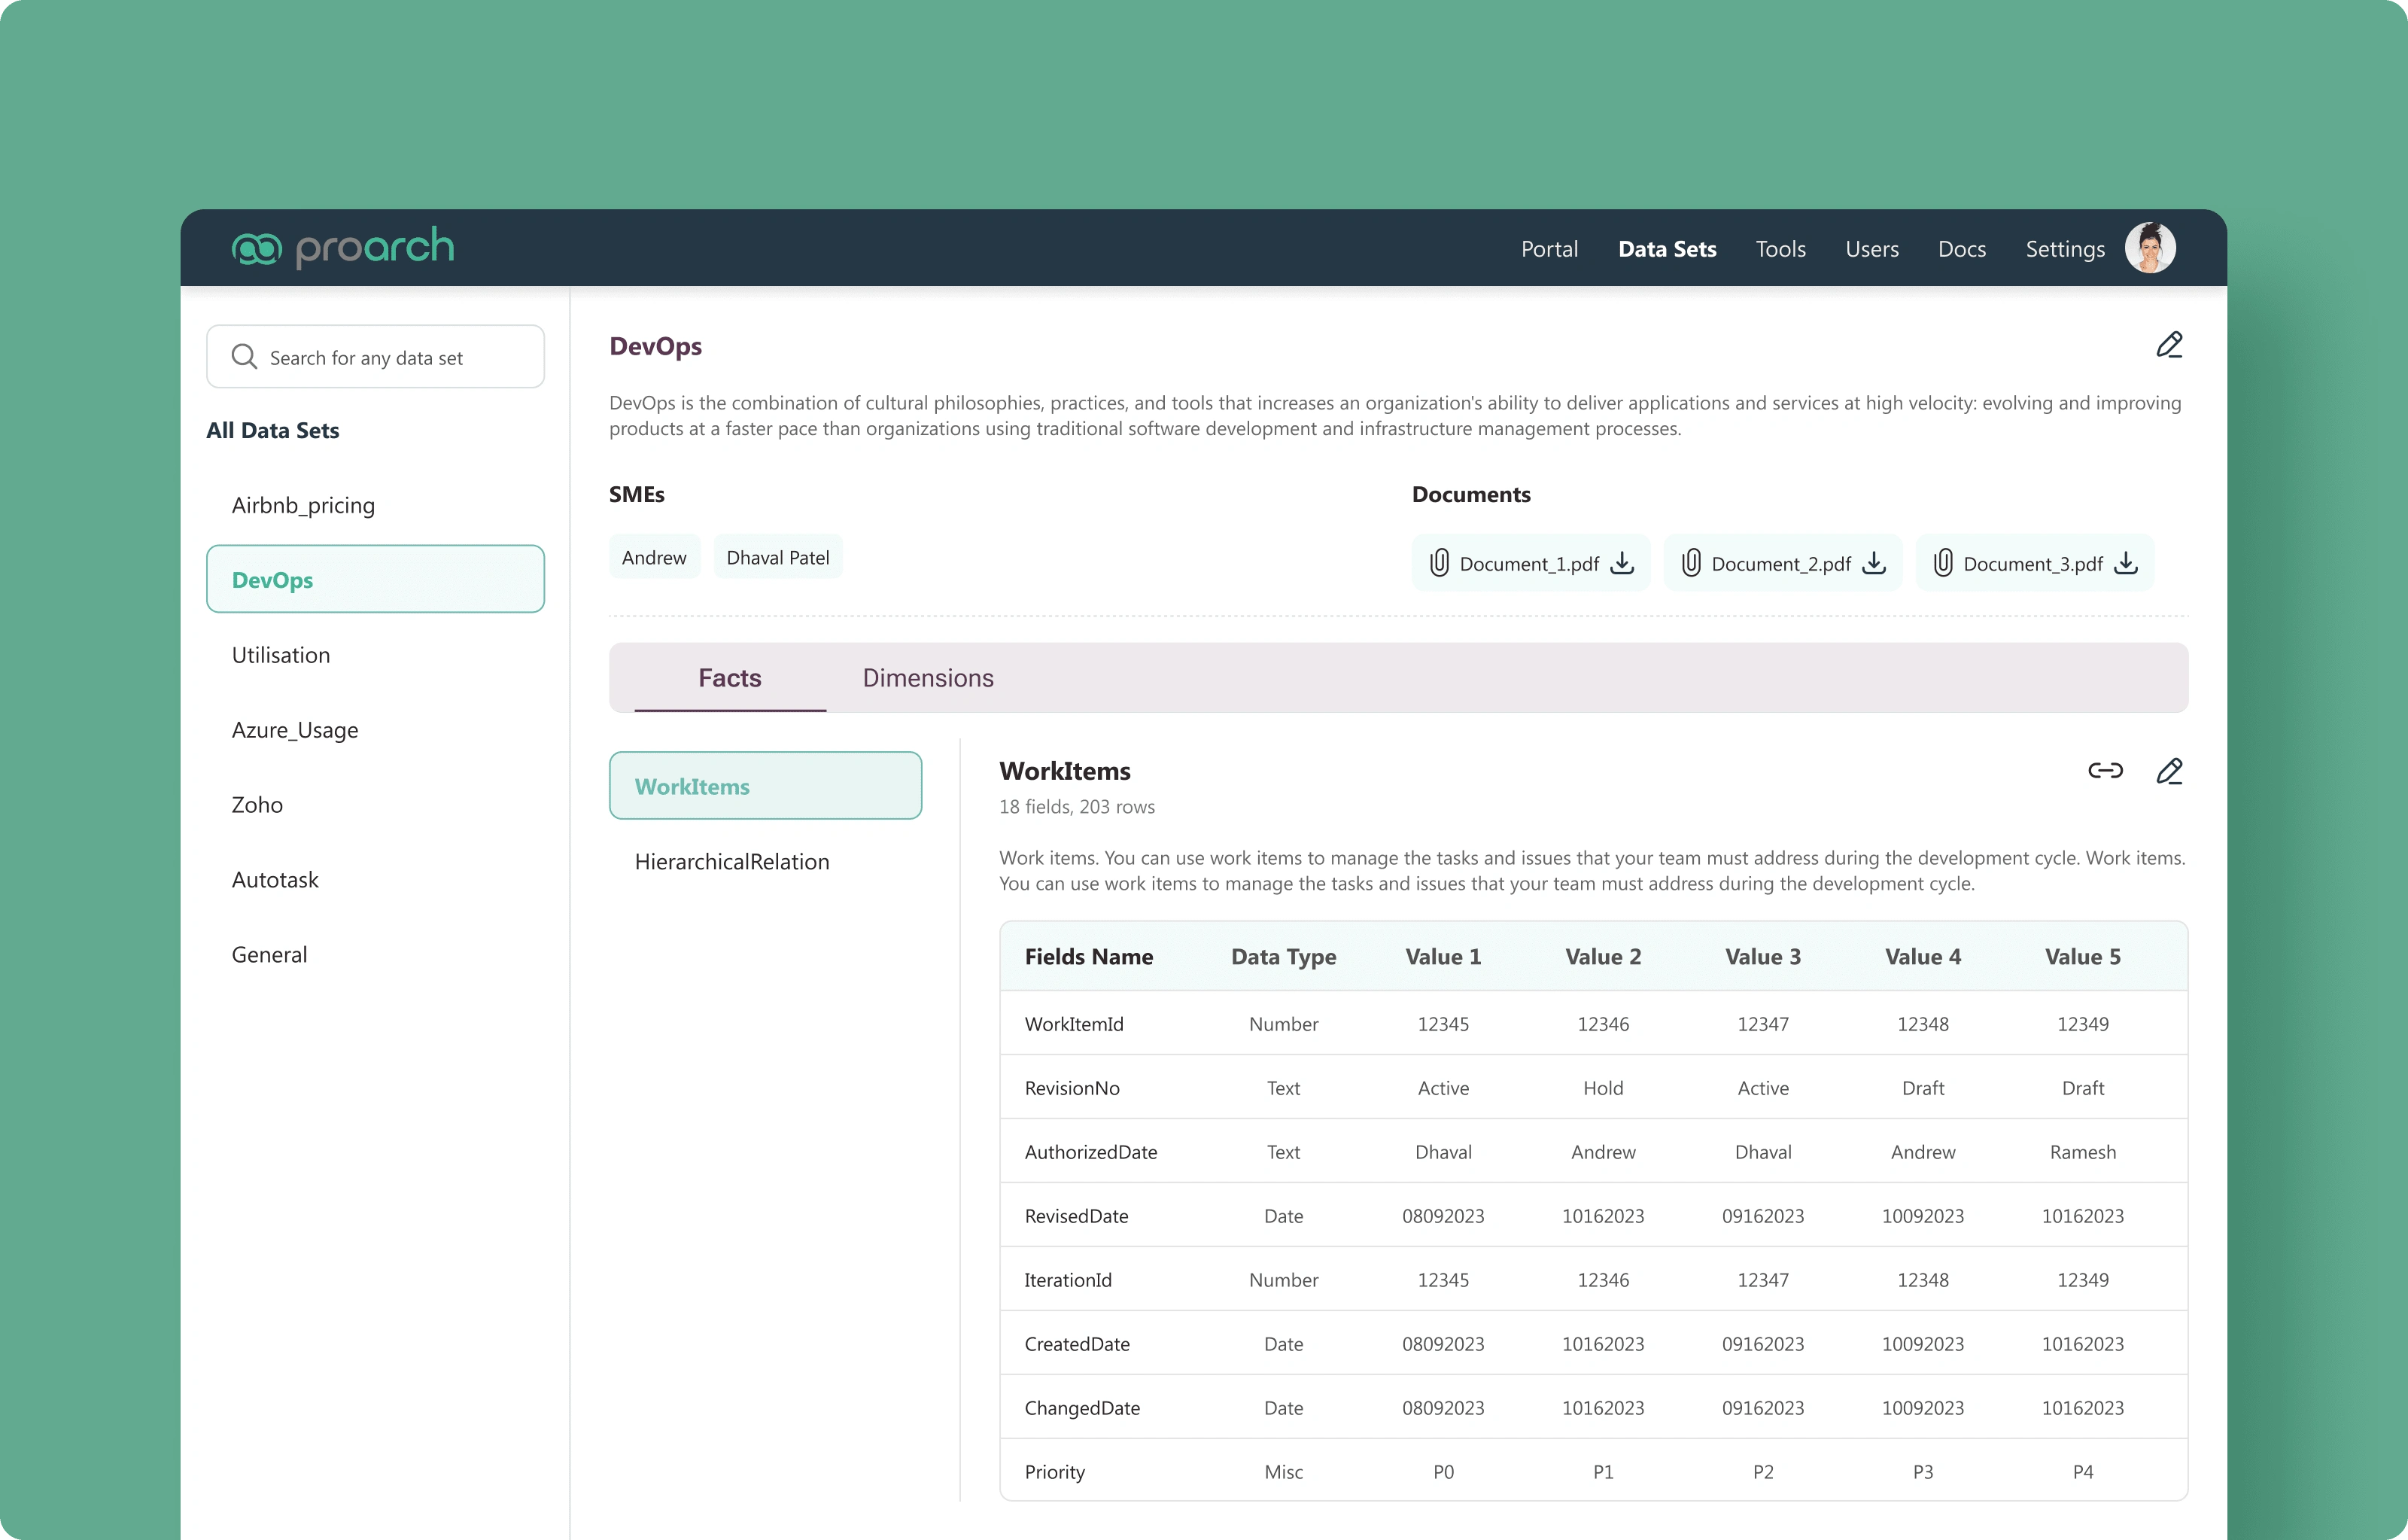
About Product
Our resource utilization tool transforms complex organizational data and provides critical actionable insights across business functions, with customizable reports and features based on user roles.
For example, finance teams can access cost optimization and spending analysis reports to drive decision-making.
Why Redesign?
Two key factors drove the redesign:
Market Opportunity: While originally designed as an internal tool, we recognized its potential as a client-facing product—but the existing UX wasn't competitive.
User Friction: We consistently received feedback that the interface wasn't intuitive for new users.
Design Process
1. Discovery & Research
Conducted a personal product evaluation as a first-time user
Interviewed users across experience levels and departments
Collaborated with developers to understand technical constraints and opportunities
2. Key Insights
Adoption Barriers: We needed to create an intuitive interface that would reduce training time for new users
Functionality Gaps: Opportunities existed to automate processes and add depth, reducing dependency on supplementary tools
Scalability Requirements: The design needed to align with our design system while being adaptable to client branding
3. Design & Iteration
Created initial wireframes based on scope definition
Facilitated multiple collaborative sessions with developers, project managers, and stakeholders
Refined the functionality and usability through iterative feedback
Developed final designs that met our first-version scope requirements
4. Validation & Refinement
Presented demos to internal users and potential clients
Incorporated feedback to improve designs before launch
Collaborated closely with developers during implementation
Solution
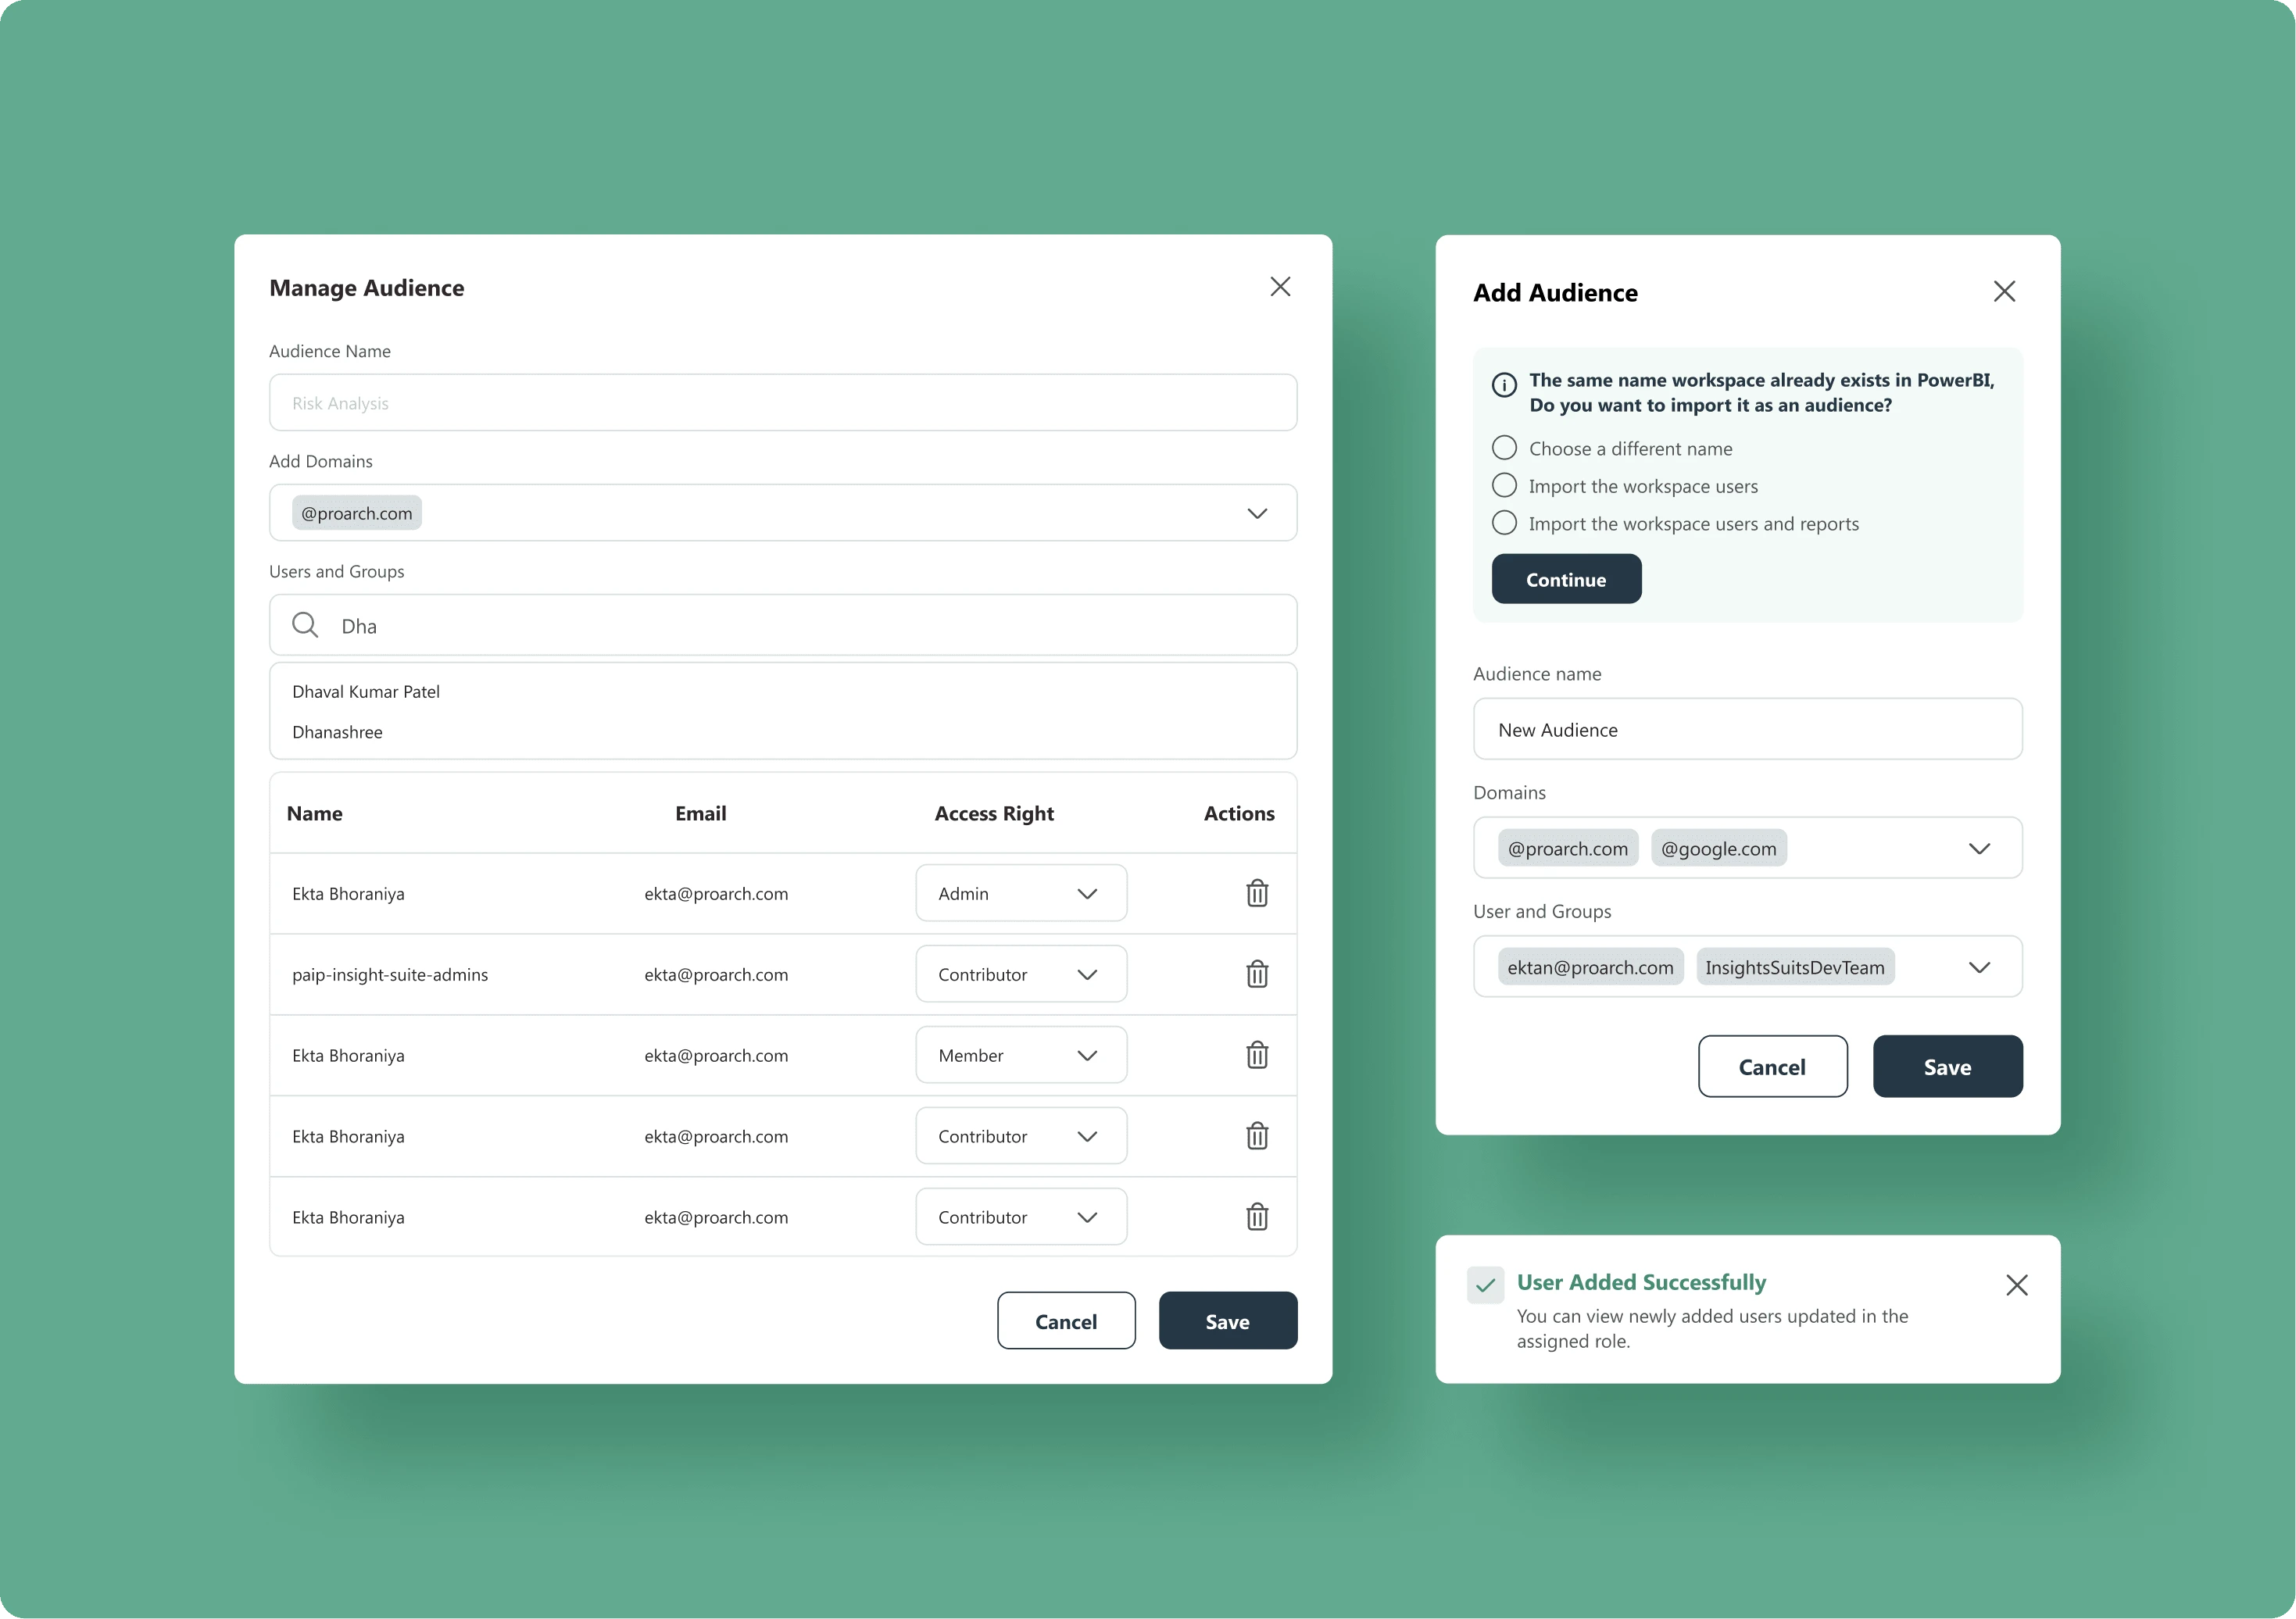
The platform was designed to serve multiple stakeholders with specific needs.
We tackled the challenge of presenting large datasets through:
Interactive reports optimized for quick comprehension
Customizable views for different user roles
Quick access shortcuts to frequently accessed reports
The design prioritized:
Intuitive navigation between different report types
Easy access to frequently used features
Consistent design patterns across all modules
Flexible architecture to accommodate client-specific design systems
Old Design
New Designs
Prototype link
Impact
New Business: Successfully converted one of two potential clients during initial demos
Increased Productivity: Internal users reported higher efficiency due to improved report accessibility and reduced dependency on supplementary tools
Reduced Training: Onboarding time decreased by 50%, allowing faster adoption by new users
Like this project
Posted Jan 30, 2025
Complex enterprise solutions that serve multiple stakeholder needs while maintaining simplicity and usability.