Bottom left hero backgroundTop right hero background

Best Hindi-speaking freelance Data Visualizers to hire in 2025

Looking to hire Hindi-speaking Data Visualizers for your next project? Browse the world’s best freelance Data Visualizers on Contra.

Trusted by 50K+ teams from creative agencies to high growth tech companies

Logo for Wix StudioLogo for RiveLogo for WebstudioLogo for GlorifyLogo for JitterLogo for FlutterFlowLogo for PeachWebLogo for CanvaLogo for Lottie FilesLogo for Workshop BuiltLogo for BuildshipLogo for AppsumoLogo for FramerLogo for BarrelLogo for BubbleLogo for LummiLogo for WebflowLogo for GrayscaleLogo for Stride UXLogo for InstantLogo for SplineLogo for KittlLogo for RelumeLogo for HeyGenLogo for Replo
FAQs

What level of experience should I look for when hiring a freelance data visualizer?

Look for freelancers who have worked with similar data projects before. They should have examples of past work to show their expertise. It's good if they have a strong portfolio in data visualization.

How can I ensure clear communication with a freelance data visualizer?

Set up regular check-ins to discuss project progress. Make sure they understand your goals and timelines before starting. Use tools that both you and the freelancer can easily access.

What specifics should I include when defining deliverables for a data visualization project?

Clearly outline what the end project should look like. Describe the type of data and the insights you hope to gain. This helps set clear expectations for both sides.

How do I evaluate a data visualizer's portfolio effectively?

Look at their past work to see if it matches your needs. Check if their style aligns with your project goals. A strong portfolio should demonstrate clear, effective visual storytelling.

What types of data visualization tools should I expect a freelancer to use?

Freelancers should be familiar with tools like Tableau, Power BI, or D3.js. They should choose tools based on your project's needs. Ask if they are comfortable with data visualization software.

How do I define the project's scope with a freelance data visualizer?

Start by discussing what you want the visuals to achieve. Set boundaries on what is included and what is not. A clear scope helps avoid misunderstandings later.

How can I ensure the project stays on schedule with a freelance data visualizer?

Create a timeline and agree on deadlines together. Regular updates help everyone stay on track. Adjust the plan when necessary, but keep communication open.

How do I identify the right freelance data visualizer for my industry's needs?

Find a freelancer who understands your industry's data. They should know how to represent data that aligns with industry standards. Look for someone who has worked in your sector before if possible.

How can I get a freelance data visualizer to understand the target audience?

Share information about who will view the data visuals. Discuss the audience's familiarity with data and its complexity levels. This helps the freelance visualizer tailor the visuals to fit your audience best.

Who is Contra for?

Contra is designed for both freelancers (referred to as "independents") and clients. Freelancers can showcase their work, connect with clients, and manage projects commission-free. Clients can discover and hire top freelance talent for their projects.

What is the vision of Contra?

Contra aims to revolutionize the world of work by providing an all-in-one platform that empowers freelancers and clients to connect and collaborate seamlessly, eliminating traditional barriers and commission fees.
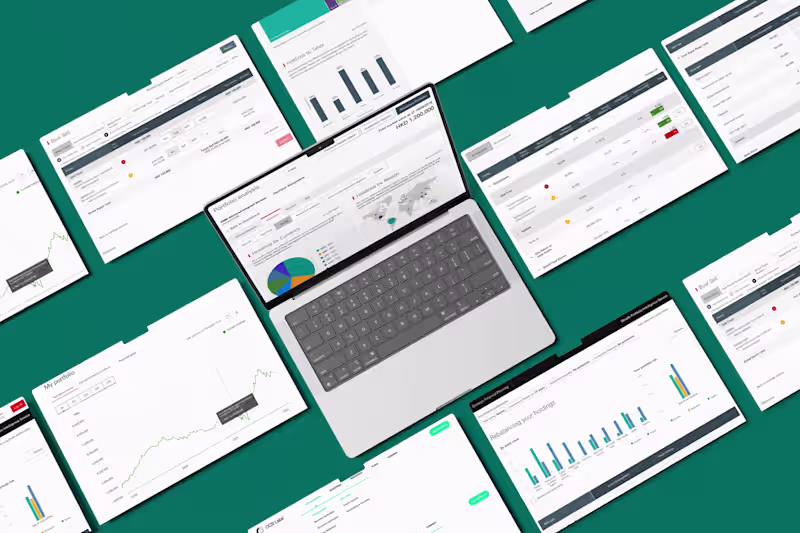
Product Analytics Expert | Mixpanel Certified
$1k+
Earned
3x
Hired
5.0
Rating
3
Followers
Transforming Data into Actionable Insights 🔍
Shaping User-Centered Solutions with Data & Design
1x
Hired
5.0
Rating
6
Followers

People also hire

Explore projects by Hindi-speaking Data Visualizers on Contra

Cover image for Sales Insights
Sales Insights
0
65
Cover image for HR Analytics
HR Analytics
0
29
Cover image for Hotel Booking Project
Hotel Booking Project
0
45
Cover image for English Premier League Table
English Premier League Table
0
14
Cover image for Titanic Analysis Project
Titanic Analysis Project
0
44
Cover image for Bikes Sales Analysis
Bikes Sales Analysis
0
233
Cover image for International Debt Statistics - PPG Bilateral Debt
International Debt Statistics - PPG Bilateral Debt
0
2
Cover image for main_palmer_penguin_EDA_2024-project
main_palmer_penguin_EDA_2024-project
0
5
Cover image for main_palmer_penguin_EDA_2024-project
main_palmer_penguin_EDA_2024-project
0
9
Cover image for Data Science Case Study : Decoding Mr. Beast's Entire Business
Data Science Case Study : Decoding Mr. Beast's Entire Business
0
87
Cover image for Exploratory Analysis of Geolocational Data
Exploratory Analysis of Geolocational Data
0
49
Cover image for 3D Pose Estimation: Motion Analysis through Computer Vision
3D Pose Estimation: Motion Analysis through Computer Vision
0
51
Cover image for Unlocking the Formula for Successful Videos on YouTube
Unlocking the Formula for Successful Videos on YouTube
0
19
Cover image for Metabase Developer - Official Partner
Metabase Developer - Official Partner
1
14
Cover image for Customer Insights Analysis
Customer Insights Analysis
0
7
Cover image for Redefining Dashboards for Indian Fintech
Redefining Dashboards for Indian Fintech
0
107
Cover image for BigQuery Developer
BigQuery Developer
1
22
Cover image for Tableau & Power BI Developer
Tableau & Power BI Developer
1
25
Cover image for Created Smarter Dashboards in Grafana to Hunt Down Issues
Created Smarter Dashboards in Grafana to Hunt Down Issues
0
8
Cover image for Taxi Fare Amount and Generous Customer Prediction
Taxi Fare Amount and Generous Customer Prediction
0
4
Cover image for Revitalized Data Analysis at Lenovo with Excel, Power BI and PPT
Revitalized Data Analysis at Lenovo with Excel, Power BI and PPT
0
7
Cover image for British Airways Reviews Analysis
British Airways Reviews Analysis
0
9
Cover image for Real Estate Sales and Distribution Analysis
Real Estate Sales and Distribution Analysis
0
8
Cover image for Coffee Shop Sales Analysis
Coffee Shop Sales Analysis
0
23
Cover image for Interactive YuGiOh Trading Card Dashboard
Interactive YuGiOh Trading Card Dashboard
0
8
Cover image for Edmonton SafeYEG Map
Edmonton SafeYEG Map
0
6
Cover image for Data Pipeline and Embeddable Visual Widgets Using APIs
Data Pipeline and Embeddable Visual Widgets Using APIs
0
19
Cover image for IATI Publisher | Frontend Development
IATI Publisher | Frontend Development
0
11
Cover image for Career Service Center | Frontend Development
Career Service Center | Frontend Development
0
11
Cover image for Chatgpt_reviews_sentiment_analysis
Chatgpt_reviews_sentiment_analysis
0
2
Cover image for Extracting and Visualizing Stock Data
Extracting and Visualizing Stock Data
0
2
Cover image for COVID-19 Data Analysis Using Python
COVID-19 Data Analysis Using Python
0
0
Cover image for Creating a Staff Portal for Holistic Customer Portfolio Insights
Creating a Staff Portal for Holistic Customer Portfolio Insights
0
31
Cover image for [Case Studies] How I helped startups with product growth
[Case Studies] How I helped startups with product growth
0
29
Cover image for Data_analysis
Data_analysis
0
1
Cover image for Analytics at CRED
Analytics at CRED
0
18
Cover image for Analytics at SHEROES
Analytics at SHEROES
1
5
Cover image for DATA ANALYSIS: Insights On Electric Vehicles Launch In India
DATA ANALYSIS: Insights On Electric Vehicles Launch In India
0
2
Cover image for Interactive Dashboard Design for Enhanced Data Insights
Interactive Dashboard Design for Enhanced Data Insights
0
2
Cover image for Telecom Churn Analysis
Telecom Churn Analysis
0
2
Cover image for Predicting Disease Outbreak
Predicting Disease Outbreak
0
1
Cover image for Superstore Sales Analysis
Superstore Sales Analysis
0
2
Cover image for Zomato Advanced Power BI Project
Zomato Advanced Power BI Project
1
0
Cover image for Vihang-Chandra/DS_Car_loan_linear_regression
Vihang-Chandra/DS_Car_loan_linear_regression
0
1

Top services from Hindi-speaking Data Visualizers on Contra

Top locations for Hindi-speaking Data Visualizers