IRIS FLOWER CLASSIFICATION
Ali Hassan
Data Analysis and Modeling Documentation
Importing Libraries
In this section, we import essential Python libraries for data analysis and modeling. These libraries include
numpy for numerical operations, pandas for data manipulation, matplotlib.pyplot for data visualization, seaborn for enhanced data visualization, and modules from scikit-learn for machine learning.Loading the Iris Dataset
We load the Iris dataset from a CSV file located at 'D:\Data Analyst\CodSoft\Task 2\IRIS.csv' into a Pandas DataFrame named
iris_data.Data Preparation
Splitting Data into Features and Labels
We split the dataset into features (X) and target labels (y):
We create the feature matrix
X by dropping the 'Species' column from iris_data.We create the target vector
y containing the 'Species' column.Splitting Data into Training and Testing Sets
We split the data into training and testing sets for model evaluation:
We use
train_test_split() from sci-kit-learn to split X and y into X_train, X_test, y_train, and y_test.The test size is set to 30% of the data, and a random seed (
random_state) is set for reproducibility.Support Vector Machine (SVM) Modeling
Creating and Training the SVM Model
We create and train a Support Vector Machine (SVM) model with a linear kernel:
We instantiate an SVM model with a linear kernel and probability estimates using
SVC().We fit the SVM model to the training data using
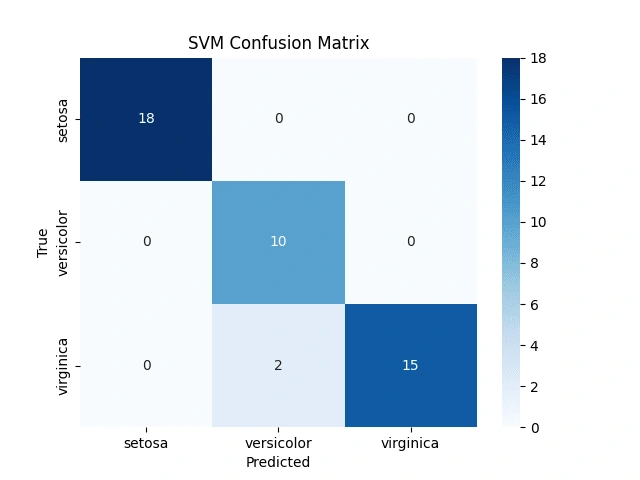
fit().Confusion Matrix for SVM
We calculate the confusion matrix for the SVM model to evaluate its performance:
The confusion matrix is computed using
confusion_matrix() sci-kit-learn.Plotting a Confusion Matrix Heatmap for SVM
We create a heatmap visualization of the confusion matrix for the SVM model:
We use
sns.heatmap() to create the heatmap with annotations.The heatmap is labeled and displayed to visualize the model's classification results.
Random Forest Modeling
Creating and Training the Random Forest Model
We create and train a Random Forest classification model with 100 estimators:
We instantiate a Random Forest model with 100 estimators and a random seed using
RandomForestClassifier().We fit the Random Forest model to the training data using
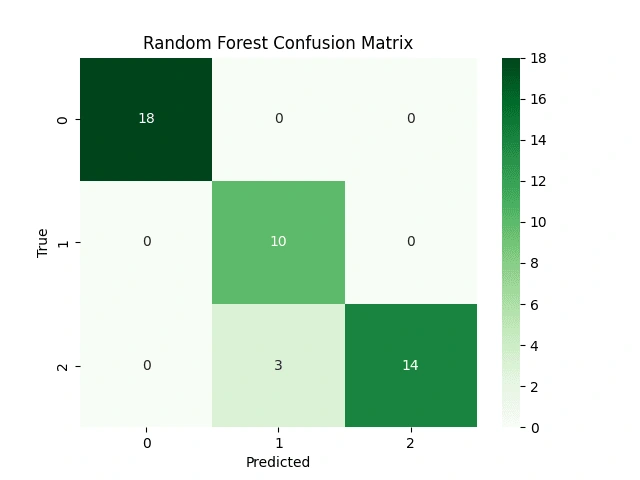
fit().Confusion Matrix for Random Forest
We calculate the confusion matrix for the Random Forest model to evaluate its performance:
The confusion matrix is computed using
confusion_matrix() from scikit-learn.Plotting a Confusion Matrix Heatmap for Random Forest
We create a heatmap visualization of the confusion matrix for the Random Forest model:
We use
sns.heatmap() to create the heatmap with annotations.The heatmap is labeled and displayed to visualize the model's classification results.
ROC Curve Analysis
ROC Curve for SVM
We create Receiver Operating Characteristic (ROC) curves for the SVM model:
We calculate the decision function scores (
y_score_svm) for the test data using decision_function().For each class in the target variable, we calculate False Positive Rate (FPR) and True Positive Rate (TPR) and compute the area under the ROC curve (AUC) using
roc_curve() and auc().ROC curves are plotted for each class, and the AUC is displayed to assess the SVM model's ability to distinguish between classes.
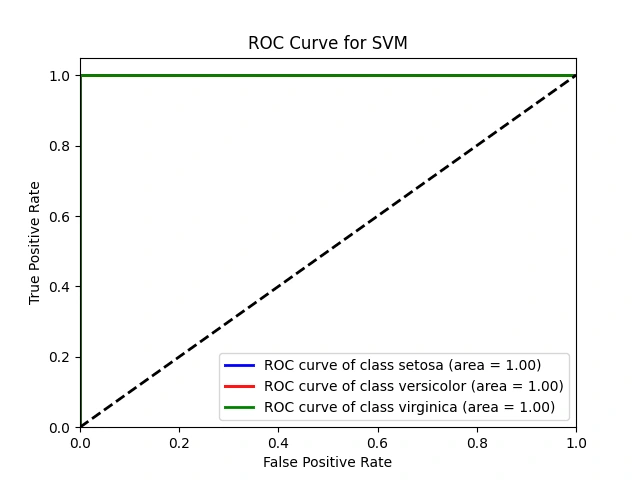
ROC Curve for SVM
ROC Curve for Random Forest
We create ROC curves for the Random Forest model:
We calculate class probabilities (
y_score_rf) for the test data using predict_proba().For each class, we calculate FPR, TPR, and AUC as in the SVM section.
ROC curves are plotted for each class, and the AUC is displayed to assess the Random Forest model's classification performance.
Overall, this code demonstrates the process of loading a dataset, splitting it for model training and testing, building two different classification models (SVM and Random Forest), evaluating their performance using confusion matrices, and assessing their ability to classify data points using ROC curves and AUC values.
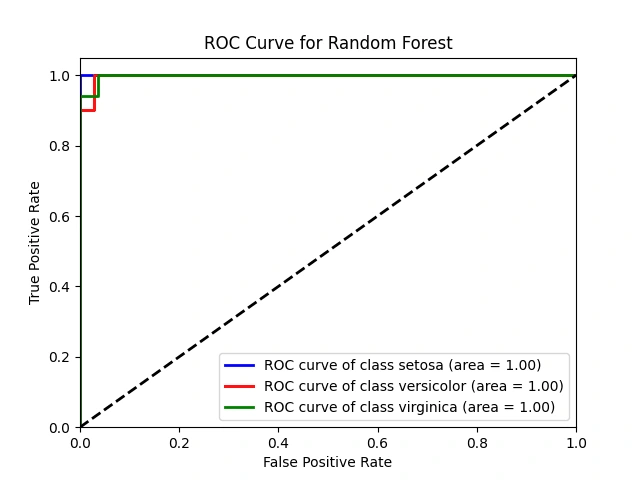
ROC Curve for Random Forest
Like this project
Posted Aug 26, 2023
Analyzing Iris dataset with SVM and Random Forest models. Assessing performance with confusion matrices and ROC curves.
Likes
0
Views
123
Clients
Codesoft