Titanic Analysis Project
Ali Hassan
Data Analysis and Modeling Documentation
Introduction
In this analysis report, we will explore and analyze the "Titanic" dataset using R. The goal is to perform various data analysis tasks and answer several questions related to the dataset.
Importing Libraries
In this section, we begin by importing the necessary libraries for data analysis and modeling. The libraries include
dplyr, tidyr, ggplot2, and tidyverse.Loading the Titanic Dataset
We load the Titanic dataset from a CSV file located at "C:\Users\user\Desktop\DSF Project\Titanic.csv" into a variable named
Titanic.Data Pre-processing
Examining the Data
We start by examining the Titanic dataset:
We calculate and display the number of rows and columns in the dataset using the
dim() function.We display the first few rows of the dataset using the
head() function.We display the column names using the
colnames() function.We count the number of missing values in the dataset using
sum(is.na(Titanic)).Handling Missing Values
Given that there are a substantial number of missing values in the dataset (87), we decided not to omit entire rows with missing data.
We count the number of missing values in each column using
colSums(is.na(Titanic)).For the "Age" column (which has 86 missing values), we replace these missing values with the median of the "Age" column, ignoring NAs.
We then remove any rows with any remaining missing values using
na.omit(Titanic).Data Structure and Summary Statistics
We check the number of missing values again to ensure that there are none.
We display the structure of the modified dataset using
str(Titanic).We provide summary statistics for the modified dataset using
summary(Titanic).Prepare the Data for Modeling
Feature Selection and Transformation
We select relevant features (Age, Sex, Pclass, SibSp, Survived, Parch) from the modified dataset into a variable named
features.We convert the "Sex" variable from categorical to a factor using
as.factor().We further convert categorical variables to dummy variables by transforming "Sex" to numeric values.
Data Splitting
We set the random seed for reproducibility using
set.seed(123).We split the data into training and testing sets, with 70% of the data in the training set and 30% in the testing set. The indices for splitting are generated using
sample().Linear Regression
Model Building
We build a linear regression model to predict "Survived" using all available features.
The model is constructed using
lm().Model Evaluation
We make predictions on the test data using
predict(), and we classify predictions based on a threshold of 0.5.We calculate evaluation metrics: Mean Squared Error (MSE), Root Mean Squared Error (RMSE), and R-squared.
Visualization
We create a data frame with actual and predicted values.
Scatter Plot: We generate a scatter plot with a best-fit line to visualize predicted vs. actual fare
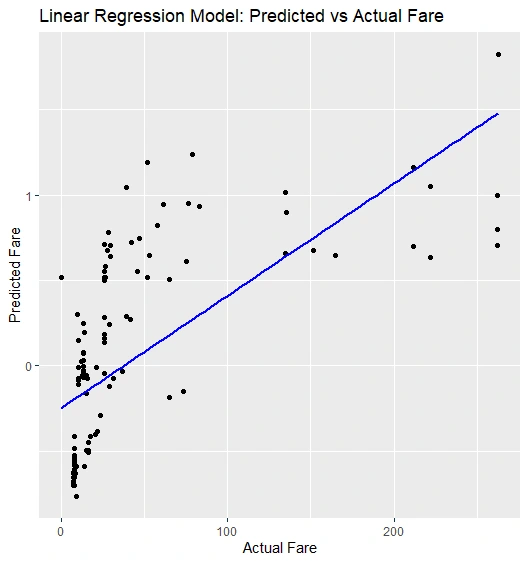
Scatter Plot
Logistic Regression
Model Building
We build a logistic regression model to predict "Survived" using all available features.
The model is constructed using
glm() with a binomial family and a maximum of 100 iterations.We make predictions on the test data using
predict(), and we classify predictions based on a threshold of 0.5.Model Evaluation
We calculate the confusion matrix for the logistic regression predictions.
We compute the accuracy of the logistic regression model using the confusion matrix.
We print the accuracy and provide a summary of the logistic regression model using
summary().Visualization of Classification Results
We create a data frame containing actual and predicted values.
Count Plot: We generate a count plot showing the count of passengers by "Pclass" and "Survived."
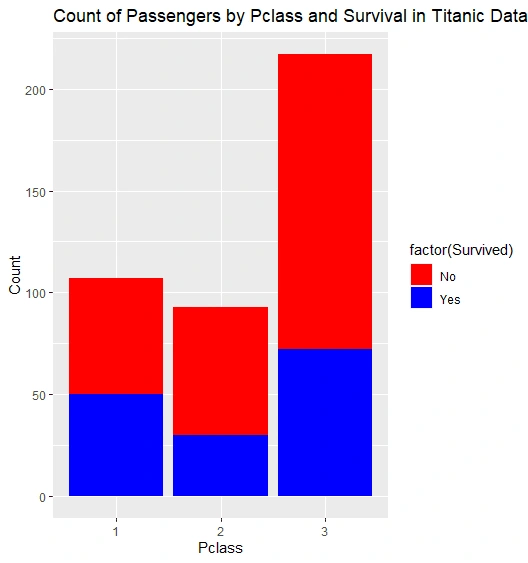
Count Plot
Box Plot: Distribution of Age by Survival
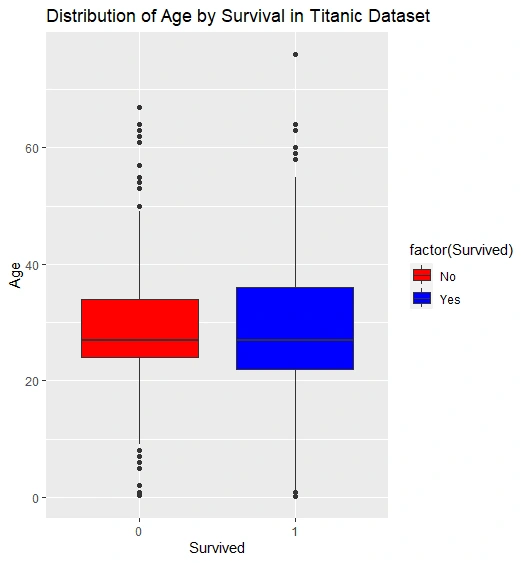
Box Plot
K-Means Clustering
Model Building
We perform k-means clustering with k=3 clusters on the selected features.
We assign cluster labels to the data points.
Visualization
We add cluster labels to the Titanic dataset and create scatter plots, histograms, and box plots to visualize clusters and age distribution.
K-means Clustering: Age vs. Fare
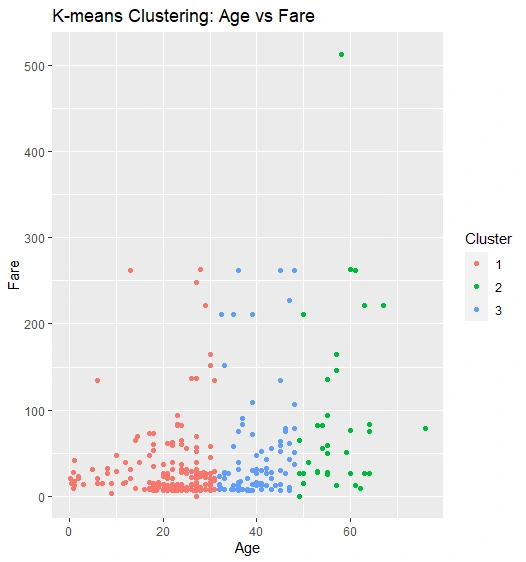
Clustering by scatter plot
Histogram of Age
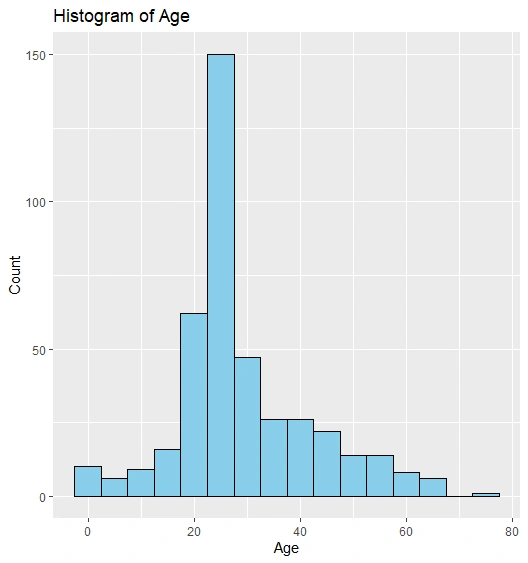
Histogram Plot
Box Plot of Age by Passenger Class
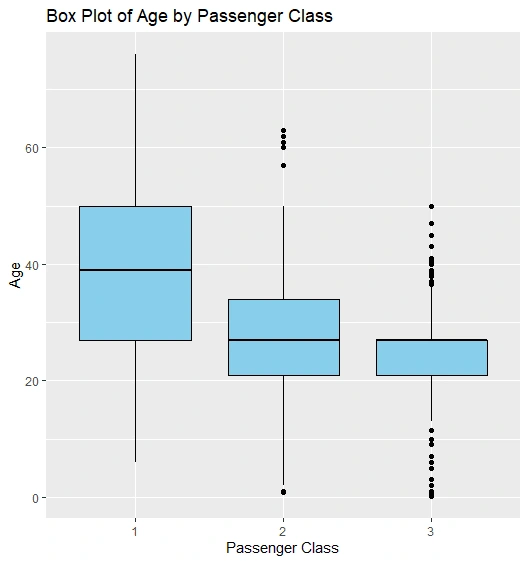
Box Plot
Model Comparison Visualization
We compare the performance of the three models (Logistic Regression, Linear Regression, and K-Means Clustering) by calculating and visualizing their accuracies in a bar chart using
ggplot2.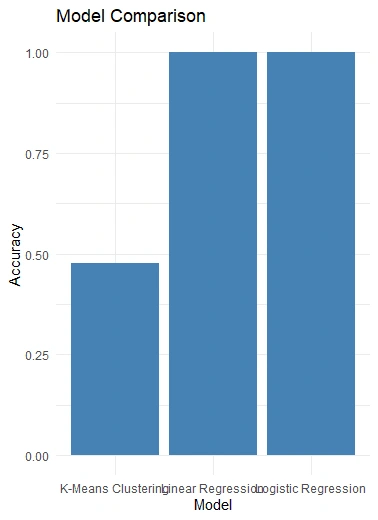
Models Comparison
Conclusion
In this analysis, we identified a predictive problem from the "Titanic" dataset and explored the data to gain insights. We applied various wrangling operations to clean and prepare the dataset for modeling. We then chose a linear regression algorithm to solve the predictive problem and visualized the predictions using a scatter plot. Additionally, we performed classification and clustering analyses using logistic regression and K-means clustering, respectively. We compared the results from different models and assessed their stability using visualization techniques such as count plots and box plots.
Like this project
Posted Jun 9, 2023
This project aimed to compare the performance and stability of three models applied to the Titanic dataset: Linear, Logistic Regression, and K-means clustering.
Likes
0
Views
56
Clients
Codesoft