Sales Insights
Ali Hassan
Introduction:
The Sales Analysis Project for Atliq Corporation focuses on analyzing and exploring the sales data of the corporation using SQL, Excel, and Power BI. By leveraging these tools, the project aims to provide valuable insights into the company's sales performance, customer behavior, and market trends. The gathered information will empower stakeholders to make informed decisions and optimize their business operations.
Objectives:
The primary objectives of the Sales Analysis Project are as follows:
Sales Data Analysis: Analyze the sales data to identify trends, patterns, and key performance indicators related to revenue, profit, and growth.
Product and Region Identification: Determine the top-selling products and regions based on the company's sales data to strategize marketing and distribution efforts.
Customer Behavior Exploration: Explore customer behavior and factors influencing their purchasing decisions to enhance customer satisfaction and retention.
Dashboard Creation: Develop interactive Power BI reports to provide stakeholders with a comprehensive overview of sales performance for data-driven decision-making.
Data Collection:
The project utilizes the company's sales data from the past four years, sourced from the internal database. The data consists of various attributes, including sales figures, product information, customer details, and geographic data.
Analysis
Upon analysis of the Raw data, it was found that it has 5 Data Tables including:
sales customers: This data table consists of 3 columns including, customer_name,customer_code, and customer_type. It has a total of 38 rows.
sales date: This data table consists of 5 columns including, date, cy_date, year, month_name, and date_yy_mmm consisting of 1126 rows.
sales market: This data table consists of 3 columns including, market_code, market_name, and zone, consisting of 15 rows.
sales product: This data table consists of 2 columns including product_code and produc_type which consist of 279 rows.
sales transaction: This data table consists of 11 columns including, product_code, market_code, customer_code, order_date, sales_qty, sales_amount, currency, norm_sales_amount, ProfitMargin%, Profit_Margin, and cost_price. This table consists of 148,395 rows.
Data Cleaning and Preprocessing:
SQL is employed to clean and preprocess the data, ensuring accuracy and consistency.
Data Cleaning
a. Handling Missing Values:
Identified and assessed columns with missing values.
Used SQL's COALESCE() function to replace NULL values with appropriate defaults or placeholders.
Employed SQL's ISNULL() function to handle NULL values in conditional statements.
b. Handling Duplicates:
Checked for duplicate records in the Sales dataset.
Utilized SQL's DISTINCT keyword to retrieve unique records.
Employed SQL's GROUP BY clause and aggregate functions (e.g., COUNT, SUM) to summarize data and identify duplicate entries.
c. Data Type Conversion:
Inspected data types of columns to ensure consistency and accuracy.
Used SQL's CAST() or CONVERT() functions to convert data into appropriate data types.
Ensured that dates were in proper date formats for accurate analysis.
d. Data Validation:
Verified data accuracy by running SQL queries with conditional checks.
Used SQL's CASE statement to create custom validation rules and flag inconsistent data.
Cross-referenced data against external sources or reference tables to validate correctness.
Data Exploration:
Basic Statistics:
Employed SQL's aggregate functions (e.g., COUNT, SUM, AVG, MIN, MAX) to calculate basic statistics.
Extracted insights on the total number of sales, average sales, maximum and minimum sales amounts, etc.
Time-based Analysis:
Extracted year, month, and day components from the Date column using SQL's DATEPART() or EXTRACT() functions.
Grouped sales data by months, quarters, or years to identify seasonal patterns and trends.
Segmentation and Grouping:
Segmented sales data is based on various dimensions like product categories, customer segments, countries, or states.
Utilized SQL's GROUP BY clause to group data and perform aggregate functions on each group.
Derived key performance indicators (KPIs) for different segments, such as average sales per category or region.
Visualization:
Power BI was the chosen software to create a real-time dashboard to visualize insights. Used Dax Formulas to make new measures, which are as follows:
Profit Margin%
Profit Margin Contribution%
Revenue
Revenue Contribution%
Revenue LY
Total Sales QTY
Total Profit Margin
Total Profit.
The dashboard comprised three pages: Key_Insights, Profit_Analysis, and Performance_Insights.
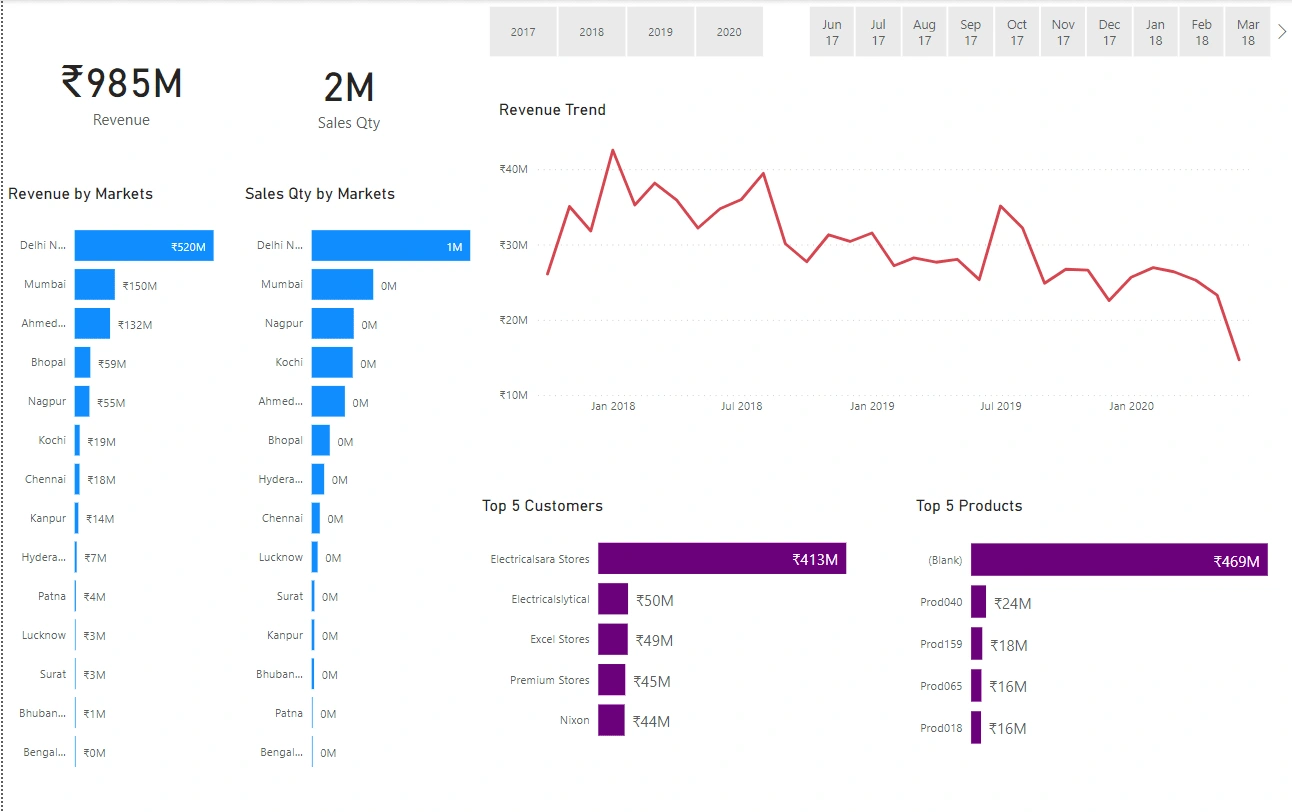
Key_Insights
2 Cards for showing Total Revenue and Total Sales
Stacked Bar Chart showing Total Revenue by Market
Stacked Bar Chart showing Total Sales QTY by Market
Line Chart showing Total Revenue by Date
Stacked Bar Chart showing top 5 customers
Stacked Bar Chart showing top 5 Products
Slicer for year and month
Key_Insights
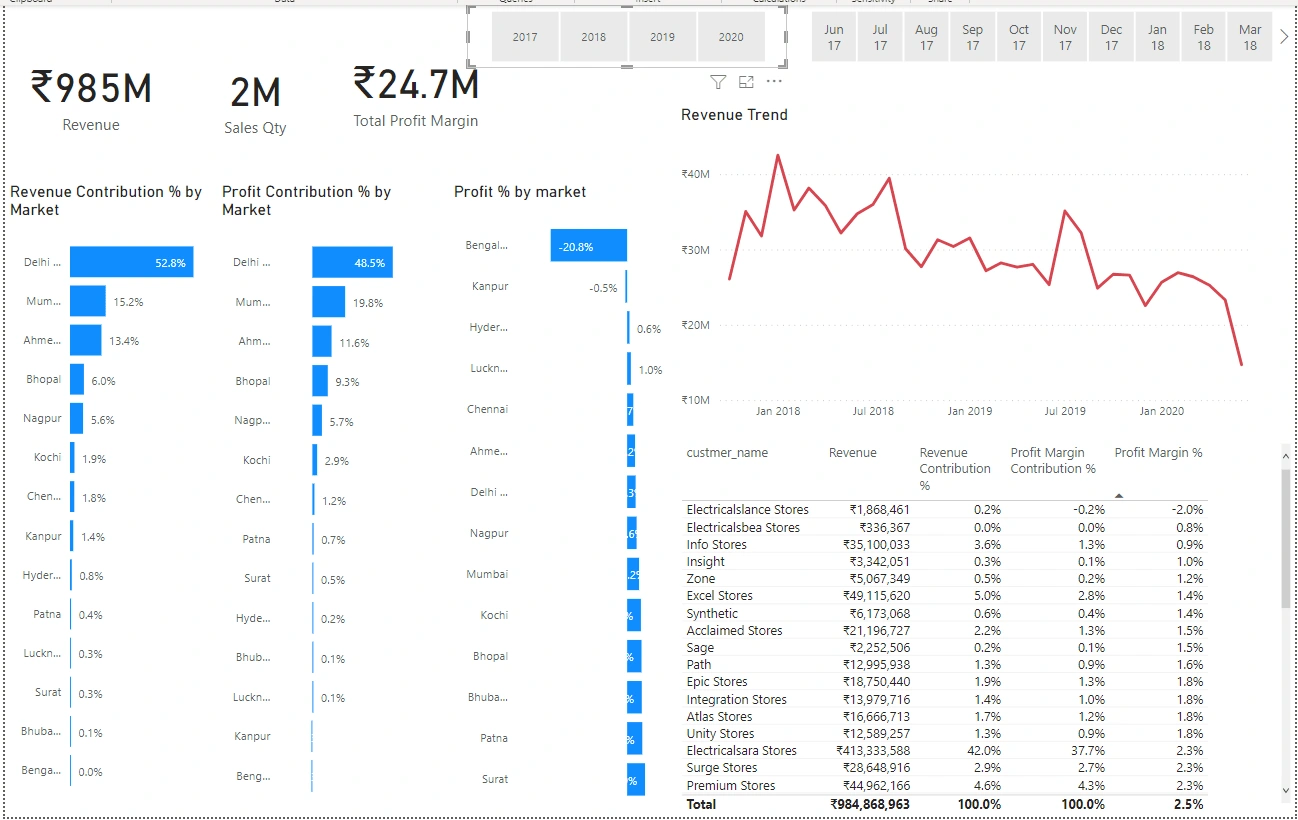
Profit_Analysis
3 Cards for showing Total Revenue, Total Sales QTY, and Total Profit
Stacked Bar Charts showing Total Revenue Contribution% by Market
Stacked Bar Charts showing Total Profit Contribution% by Market
Stacked Bar Charts showing Total Profit% by Market
Line Chart showing Total Revenue by Date
Slicer for year and month
Table showing Profit Margin%, Profit Margin Contribution%, Revenue, Revenue Contribution% per customer_name
Profit_Analysis
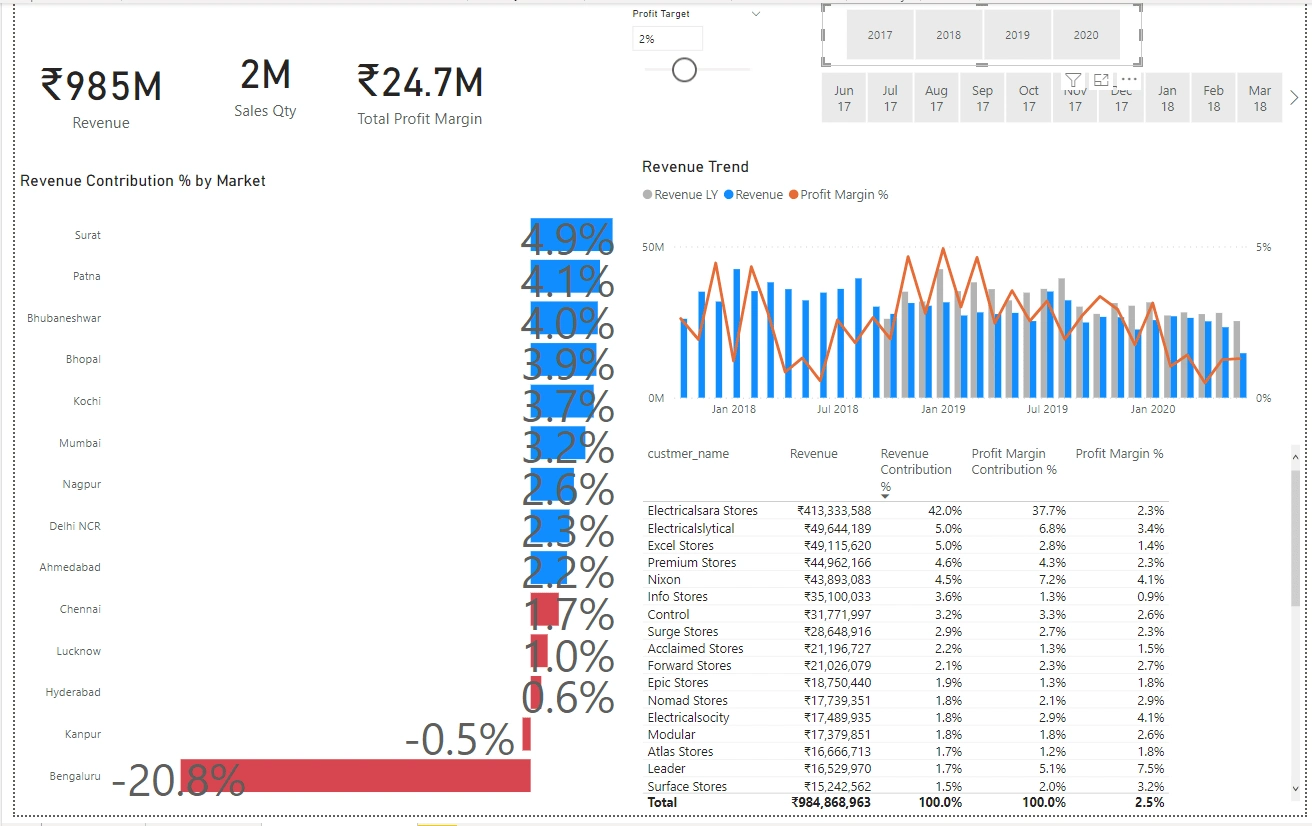
Performance_Insights
3 Cards for showing Total Revenue, Total Sales QTY, and Total Profit
Stacked Bar Charts showing Total Revenue Contribution% by Market
Slicer for year and month
Table showing Profit Margin%, Profit Margin Contribution%, Revenue, Revenue Contribution% per customer_name
Line-Clustered Column Chart showing Revenue and Profit Margin% by Day
Performance_Analysis
Interpretation of Results:
Upon analyzing the data and interpreting the results, several key findings are anticipated:
Revenue and Profit Analysis: Stakeholders will gain valuable insights into revenue and profit trends over time, enabling them to make strategic decisions accordingly.
Product Performance: Identification of top-selling products will facilitate inventory management and marketing strategies.
Customer Demographics: Understanding customer preferences based on age group and gender will allow for targeted marketing campaigns and improved customer satisfaction.
Regional Sales: Insights into sales performance across different states and countries will guide expansion plans and resource allocation.
Profit Margin: The formula to calculate profit percentage per total cost will reveal the average profit percentage, which can be used to optimize pricing strategies.
Conclusion
The Sales Analysis Project for Atliq Corporation, utilizing SQL, and Power BI, aims to provide valuable insights into sales performance, customer behavior, and market trends. The project's deliverables, including interactive reports and visualizations, will empower stakeholders to make informed and data-driven decisions, leading to enhanced business growth and profitability.
Like this project
Posted Feb 27, 2023
The Sales Analysis Project employs SQL and Power BI to analyze sales data, identify trends, and create interactive reports for data-driven business operations.