SALES PREDICTION USING PYTHON
Data Analysis and Modeling Documentation
Importing Libraries
In this section, we import the necessary Python libraries for data analysis and modeling, including
pandas, numpy, matplotlib.pyplot, seaborn, and specific modules from scikit-learn for machine learning.Loading the Dataset
We load a dataset from a CSV file named 'sales_data.csv' (you can replace this with your dataset file) into a Pandas DataFrame named
data.Data Wrangling and Cleaning
Checking for Missing Values
We start by checking for missing values in the dataset:
We use the
isnull().sum() method to calculate the number of missing values for each column.The results are printed to the console to provide an overview of missing data.
Summary Statistics
We compute summary statistics for the dataset:
Summary statistics, including count, mean, standard deviation, minimum, and maximum values, are generated using
describe().The summary statistics are printed on the console to provide an overview of the data's central tendencies and variability.
Data Visualization
Pairplot Visualization
We create a pairplot to visualize relationships between variables:
The
sns.pairplot() function generates scatterplots for the 'TV', 'Radio', and 'Newspaper' variables against the 'Sales' variable.The
plt.suptitle() function is used to set the title for the pairplot.The pairplot is displayed to visually inspect potential relationships.
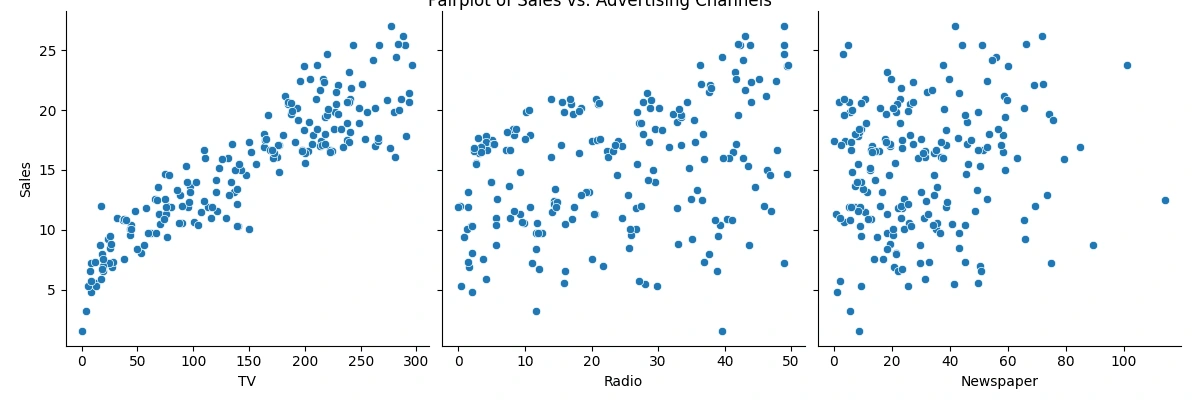
Sales vs. Advertising Channels
Heatmap Visualization
We visualize correlations between variables using a heatmap:
We calculate the correlation matrix using the
corr() method.The
sns.heatmap() function is used to generate a heatmap with annotations.The heatmap is displayed to visualize the strength and direction of correlations between variables.
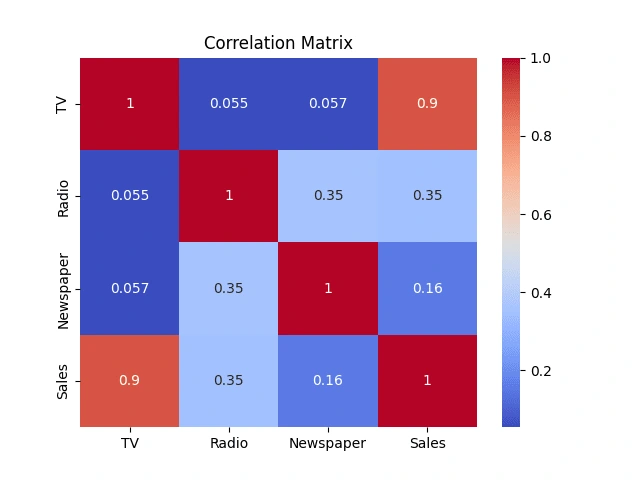
Correlation Matrix
Feature Selection
We select the features (independent variables) and the target variable (dependent variable) for our analysis:
We create a feature matrix
X containing the 'TV', 'Radio', and 'Newspaper' columns.We create a target vector
y containing the 'Sales' column.Data Splitting
We split the dataset into training and testing sets for model evaluation:
We use
train_test_split() from scikit-learn to split X and y into X_train, X_test, y_train, and y_test.The test size is set to 20% of the data, and a random seed (
random_state) is set for reproducibility.Model Creation and Training
Creating and Training the Model
We create a Linear Regression model and train it on the training data:
We instantiate a Linear Regression model using
LinearRegression().We fit the model to the training data using
fit().Making Predictions
We use the trained model to make predictions on the test data:
We use the
predict() method to generate predictions for X_test, resulting in y_pred.Model Evaluation
Evaluating the Model
We evaluate the model's performance:
We calculate the Mean Squared Error (MSE) and R-squared (R2) using functions from scikit-learn.
MSE measures the average squared difference between actual and predicted values.
R2 quantifies the proportion of the variance in the dependent variable explained by the independent variables.
The evaluation metrics are printed to the console.
Visualization of Predicted vs. Actual Sales
We create a scatter plot to visualize predicted vs. actual sales from the test data:
We used
plt.scatter() to create the scatter plot, where y_test represents actual sales and y_pred represents predicted sales.Axes labels and a title are added to the plot for clarity.
The plot is displayed to visualize how well the model's predictions align with actual values.
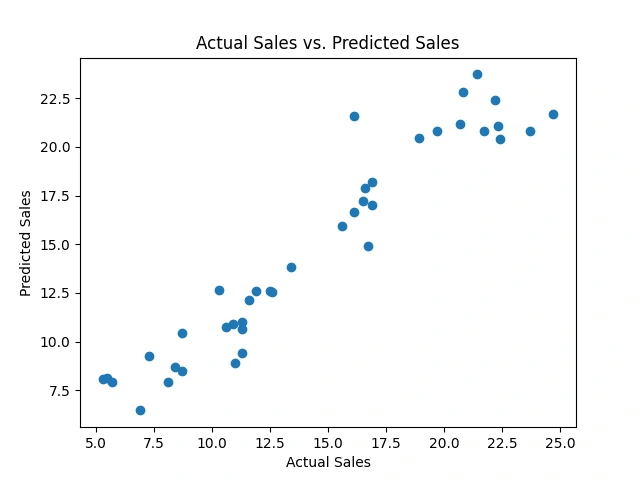
Actual VS. Predicted Sales
Using the Model for Predictions (Example)
We demonstrate how to use the trained model for predictions using a new data point:
We create a new DataFrame
new_data containing values for 'TV', 'Radio', and 'Newspaper'.We use the
predict() method to predict sales for this new data point.The predicted sales value is printed on the console.
Like this project
Posted Aug 26, 2023
Analyzing advertising channel impacts (TV, Radio, Newspaper) on sales. Employing Linear Regression model for predictive analysis, with visualization of results.


