Bikes Sales Analysis
Like this project
Posted Aug 3, 2023
"This project involved analyzing bike sales data to gain insights into sales performance and customer demographics, presented through a Power BI dashboard."
Introduction
The Bike Sales Project involved the analysis of bike sales data collected from Kaggle.com using Microsoft Excel. The project's objective was to gain insights into the sales performance, customer demographics, and profitability of the bike products. The analysis was conducted to assist in making data-driven decisions to improve business strategies and identify growth opportunities. To facilitate the presentation and real-time analysis of the findings, a Power BI Dashboard was created.
Defining the Problem/Objective:
The primary problem to address in this project was to understand the factors influencing bike sales and profitability. The key objectives were as follows:
Analyze Sales Performance: Evaluate the overall sales performance, identify top-performing products, and assess sales trends over time.
Customer Demographics: Understand customer demographics, including age groups, gender distribution, and their impact on sales.
Profitability Analysis: Calculate profit margins, analyze factors affecting profitability, and identify opportunities for cost optimization.
Data Collection:
Data Collection
The bike sales data was collected from the Kaggle.com dataset in CSV format. Used Microsoft Excel as the software for the analysis of the data.
Analysis
Upon analysis of the Raw data, it was found that it has 18 columns and over 90 rows. Column headers are as follows:
Sales_Order_Id
Date
Day
Month
Year
Customer_Age
Age_Group
Country
State
Product_Category
Sub_Catogory
Product_Description
Order_Quantity
Unit_cost
Unit_price
Profit
Cost
Total_Cost
Data Cleaning and Preprocessing:
Uncleaned Values
The data analysis identified several problems that needed cleaning and preprocessing, including:
Missing Values
Incorrect Values
Incorrect Calculations
Data Cleaning
Utilizing the Customer_Age column factor, the Age_Group column's missing value has been fixed. which came to the proper conclusion based on the customer's age group.
By looking at how the Unit_Cost, Country, and State columns relate to one another, a missing value in the Product_Description column has been removed using a filtering tool. The product description is complete. Black Mountain 200, 38.
Utilizing the filtering tool, the Order_Quantity missing value was removed by examining the Cost and Total_Cost columns. The amount is therefore determined to be 1. The two incorrect calculations in the Cost and Total_Cost columns were also removed as a result. Since they were linked by certain formulae.
Using the same filtering technique, incorrect values in the Unit_Cost and Unit_Price columns have also been removed by cross-referencing their respective fields. The two incorrect calculations in the Cost and Total_Cost columns were also removed as a result. Since they were linked by certain formulae.
Data Exploration:
Various tools were utilized to explore and analyze the data, including:
Filtering and Sorting: Filtering and sorting tools were used for data cleaning and analyzing critical data points.
Conditional Formatting: Conditional Formatting is used for the same process as the filtering and sorting tools have been used i.e., in the cleaning, analyzing, and highlighting of important information in the data.
Embedded Formulas: The MIN, MAX, and AVERAGE formulae were employed with pivot tables to analyze the Lowest, Highest, and Median values of Total_Cost, Cost, Profit, Unit_Cost, and Unit_Price. Also used these formulae to daily analyze the results.
User-Made Formulas: Created a formula to check the daily percentage of profit over total costs. This resulted in an average profit margin of 45% of daily sales.
Pivot Table
To analyze the information in the data, three Pivot Tables have been created utilizing the data. These are listed below:
Unit_Cost, Unit_Price, Total_Cost, Cost, and Profit by Date. This displayed the daily profit and expense stacks. used State, Country, Customer_Gender, and Age_Group as Slicers to focus a thorough study.
Total Cost, Cost, Profit, Unit Cost, and Unit Profit by Product Description. This demonstrated how well each product had done on the market. employed State, Country, and Gender as Slicers to further focus an in-depth investigation.
Quantity was broken down by customer_gender and nation. This allowed us to evaluate each Country's performance in terms of sales volume according to gender.
Visualization:
Power BI was the chosen software to create a real-time dashboard to visualize insights. Used Dax Formulas to make new measures, which are as follows:
Profit Margin%
Profit Margin Contribution%
Revenue
Revenue Contribution%
Revenue LY
Total Sales QTY
Total Profit Margin
Total Profit.
The dashboard comprised three pages: Home, Key_Insights, and Performance_Profit_Analysis.
Home:
3 Cards for showing Total Revenue, Total Sales QTY, and Total Profit
Stacked Bar Chart showing Revenue by each Country
Pie Chart showing Revenue by Age_Group

Home
Key_Insights
3 Cards for showing Total Revenue, Total Sales, and Total Profit
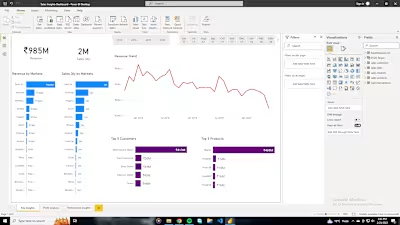
Stacked Bar Charts showing Total Revenue by each State
Stacked Bar Chart showing Total Sales QTY by each State
Line Chart showing Total Revenue by Date
Map Chart showing Countries
Slicer for Customer_Gender

Key_Insights
Performance_Profit_Analysis
3 Cards for showing Total Revenue, Total Sales QTY, and Total Profit
Stacked Bar Charts showing Total Revenue Contribution% by State
Stacked Bar Charts showing Total Profit Contribution% by Country
Line-Clustered Column Chart showing Revenue and Profit Margin% by Day

Performance_Profit_Analysis
Interpretation of Results:
The analysis and visualization of the bike sales data revealed valuable insights:
Total Revenue: The total revenue of the company is $364,000
Total Profit: The total profit of the company is $364,000
Top-performing Products: The dashboard helped identify the best-selling bike products and their revenue contributions. The top 3 products in terms of revenue are as follows:
Mountain-200 Black, 46 is the top performing product with $73K revenue
Mountain-200 Black, 38 is the 2nd most performing product with $67K revenue
Mountain-200 Silver, 38 is the 3rd most performing product with $58K revenue
Worst-performing Products: The dashboard helped identify the best-selling bike products and their revenue contributions. The top 3 products in terms of revenue are as follows:
Customer Demographics: Analyzing customer age groups and gender distribution provided insights into the target audience for specific products. following are the findings of the analysis:
Adults (35-64) age group contribute 57.37% of the total revenue with $209,000 in sales
Young Adults (25-34) age group contribute 57.37% of the total revenue with $120,000 in sales
Youth (<25) contribute just 9.32% of the total revenue with $35,000 in sales
The Female contributes about 59.34% of the total revenue with $216,000 in sales
The Male contributes about 40.62% of the total revenue with $147,000 in sales
Profitability Analysis: The Profit Margin% analysis revealed the average profit percentage of daily sales as 45%.
Sales Trends: The Line Chart and Stacked Bar Charts showcased sales trends by date, state, and country, enabling the identification of peak periods and underperforming regions.
Cost Optimization Opportunities: The analysis of profit contribution% by state and country provided insights into regions with higher profit potential and areas where cost optimization strategies could be implemented.
Overall, the Bike Sales Project successfully utilized Excel and Power BI to analyze, clean, and visualize the data, providing actionable insights to drive business decisions and improve performance.


