Created Smarter Dashboards in Grafana to Hunt Down Issues
Dhiman Seal
In this article, we will explore how to leverage Grafana’s features to build intelligent dashboards that empower teams to stay one step ahead and ensure smooth operations.
In the fast-paced world of software engineering and operations, proactively identifying and addressing incidents is crucial for maintaining system reliability and minimizing downtime. Grafana, a leading open-source analytics and monitoring platform, offers powerful capabilities to create smarter dashboards that enable teams to hunt down and mitigate potential incidents before they have a chance to impact operations.
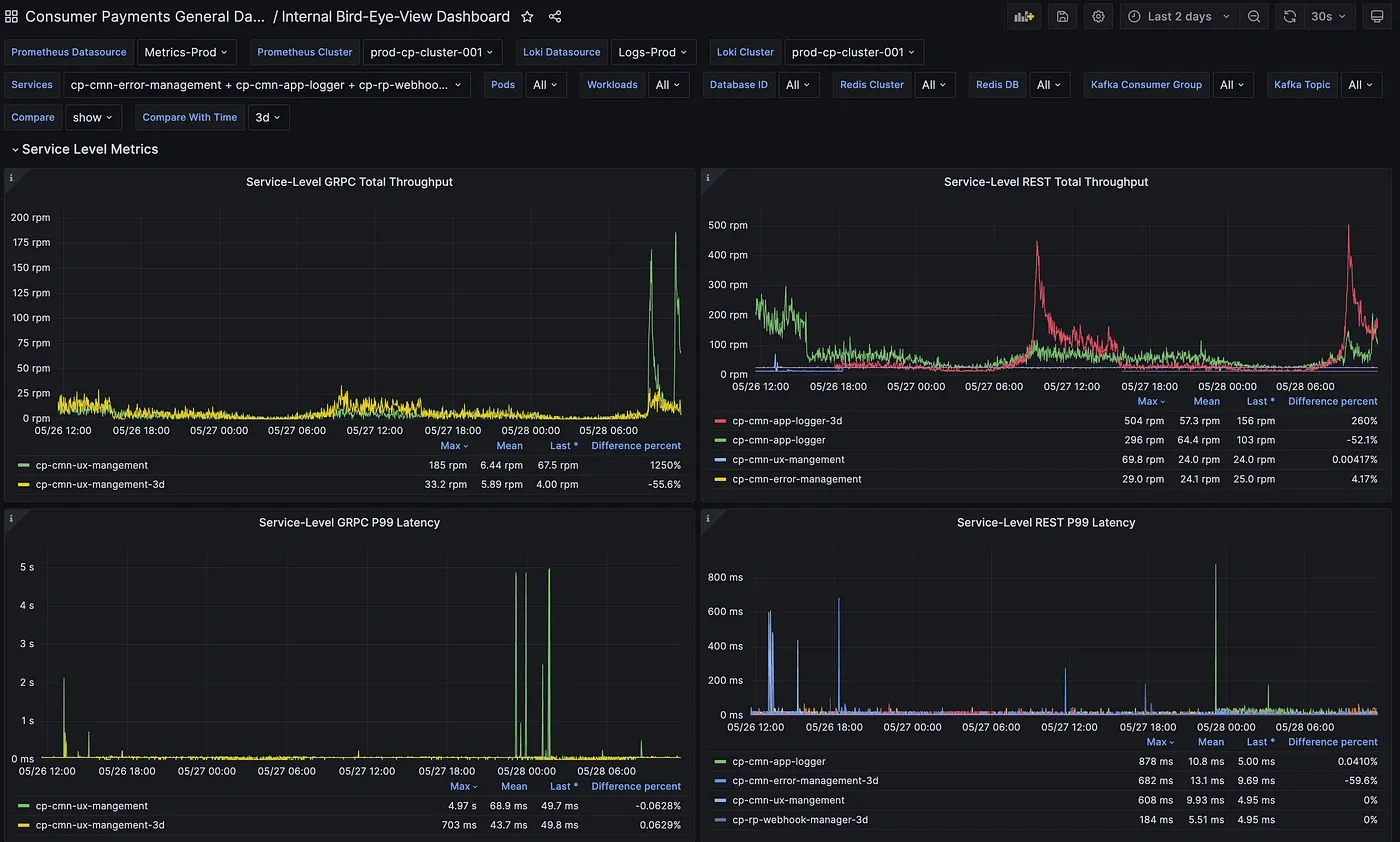
Smarter Variable based, Reusable Dashboards in Grafana
View the full article I have written about this: https://medium.com/@dhi13man/create-smarter-dashboards-in-grafana-hunt-down-issues-before-they-happen-6ccedc2dc95b
Like this project
Posted Jul 29, 2024
In this article, I talk about leveraging Grafana’s features to build intelligent dashboards that empower teams to ensure smooth operations and stay ahead.