DATA ANALYSIS: Insights On Electric Vehicles Launch In India
Anmol Kapoor
In this project, I conducted an in-depth analysis of electric vehicle (EV) sales data using Excel and Power BI to uncover key insights and trends in the industry. By leveraging advanced data visualization and analytical techniques, I identified a 15% year-over-year growth trend, highlighting emerging market opportunities and consumer preferences.
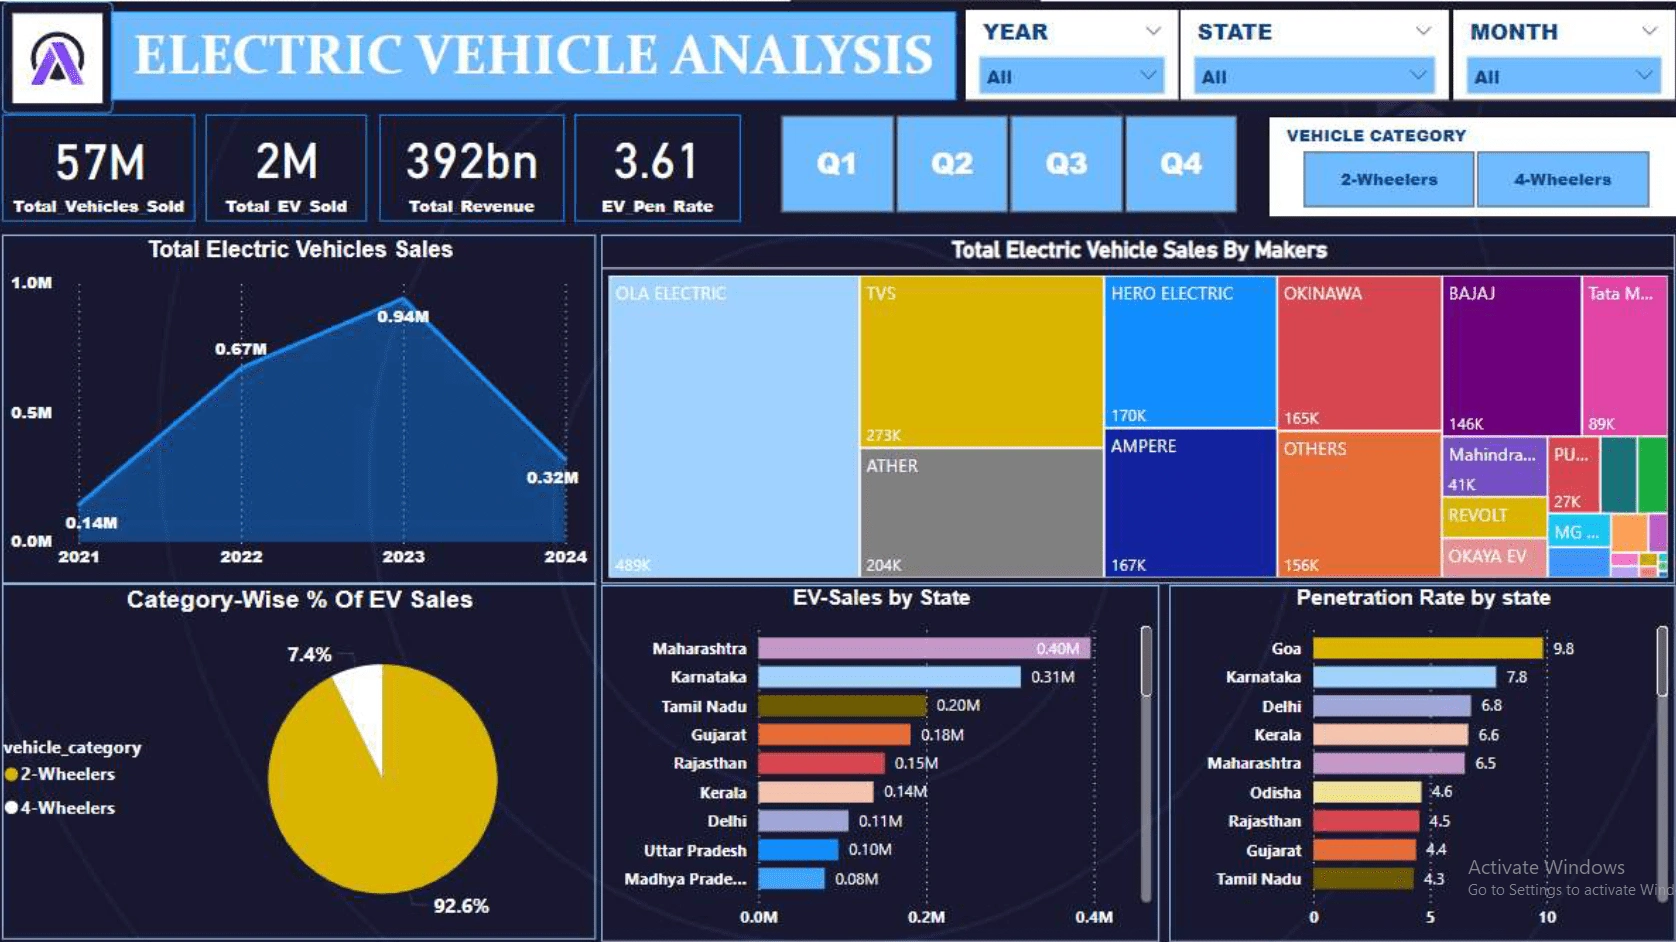
Dynamic Dashboard
To ensure data integrity and accuracy in my project, I followed these steps:
Data Cleaning: I used Advanced Excel Functions for removing duplicates, handling missing values, and standardizing formats (e.g., dates and numerical fields).
Validation Rules: I implemented validation checks to identify outliers and inconsistencies, such as verifying sales figures against expected ranges and cross-referencing data sources.
Automation: I automated repetitive tasks using Python scripts to minimize manual errors and ensure consistent processing.
Data Verification: I compared key metrics before and after cleaning to ensure no critical information was lost or altered.
Documentation: I documented the data cleaning and transformation steps, enabling transparency and reproducibility.
Collaborative Review: I shared the cleaned dataset with the team for feedback, ensuring alignment on accuracy.
Like this project
Posted Feb 2, 2025
I specialize in sales, finance, and operational data analysis, helping businesses make smarter, data-backed decisions.