Edmonton SafeYEG Map
Sarmad Cheema
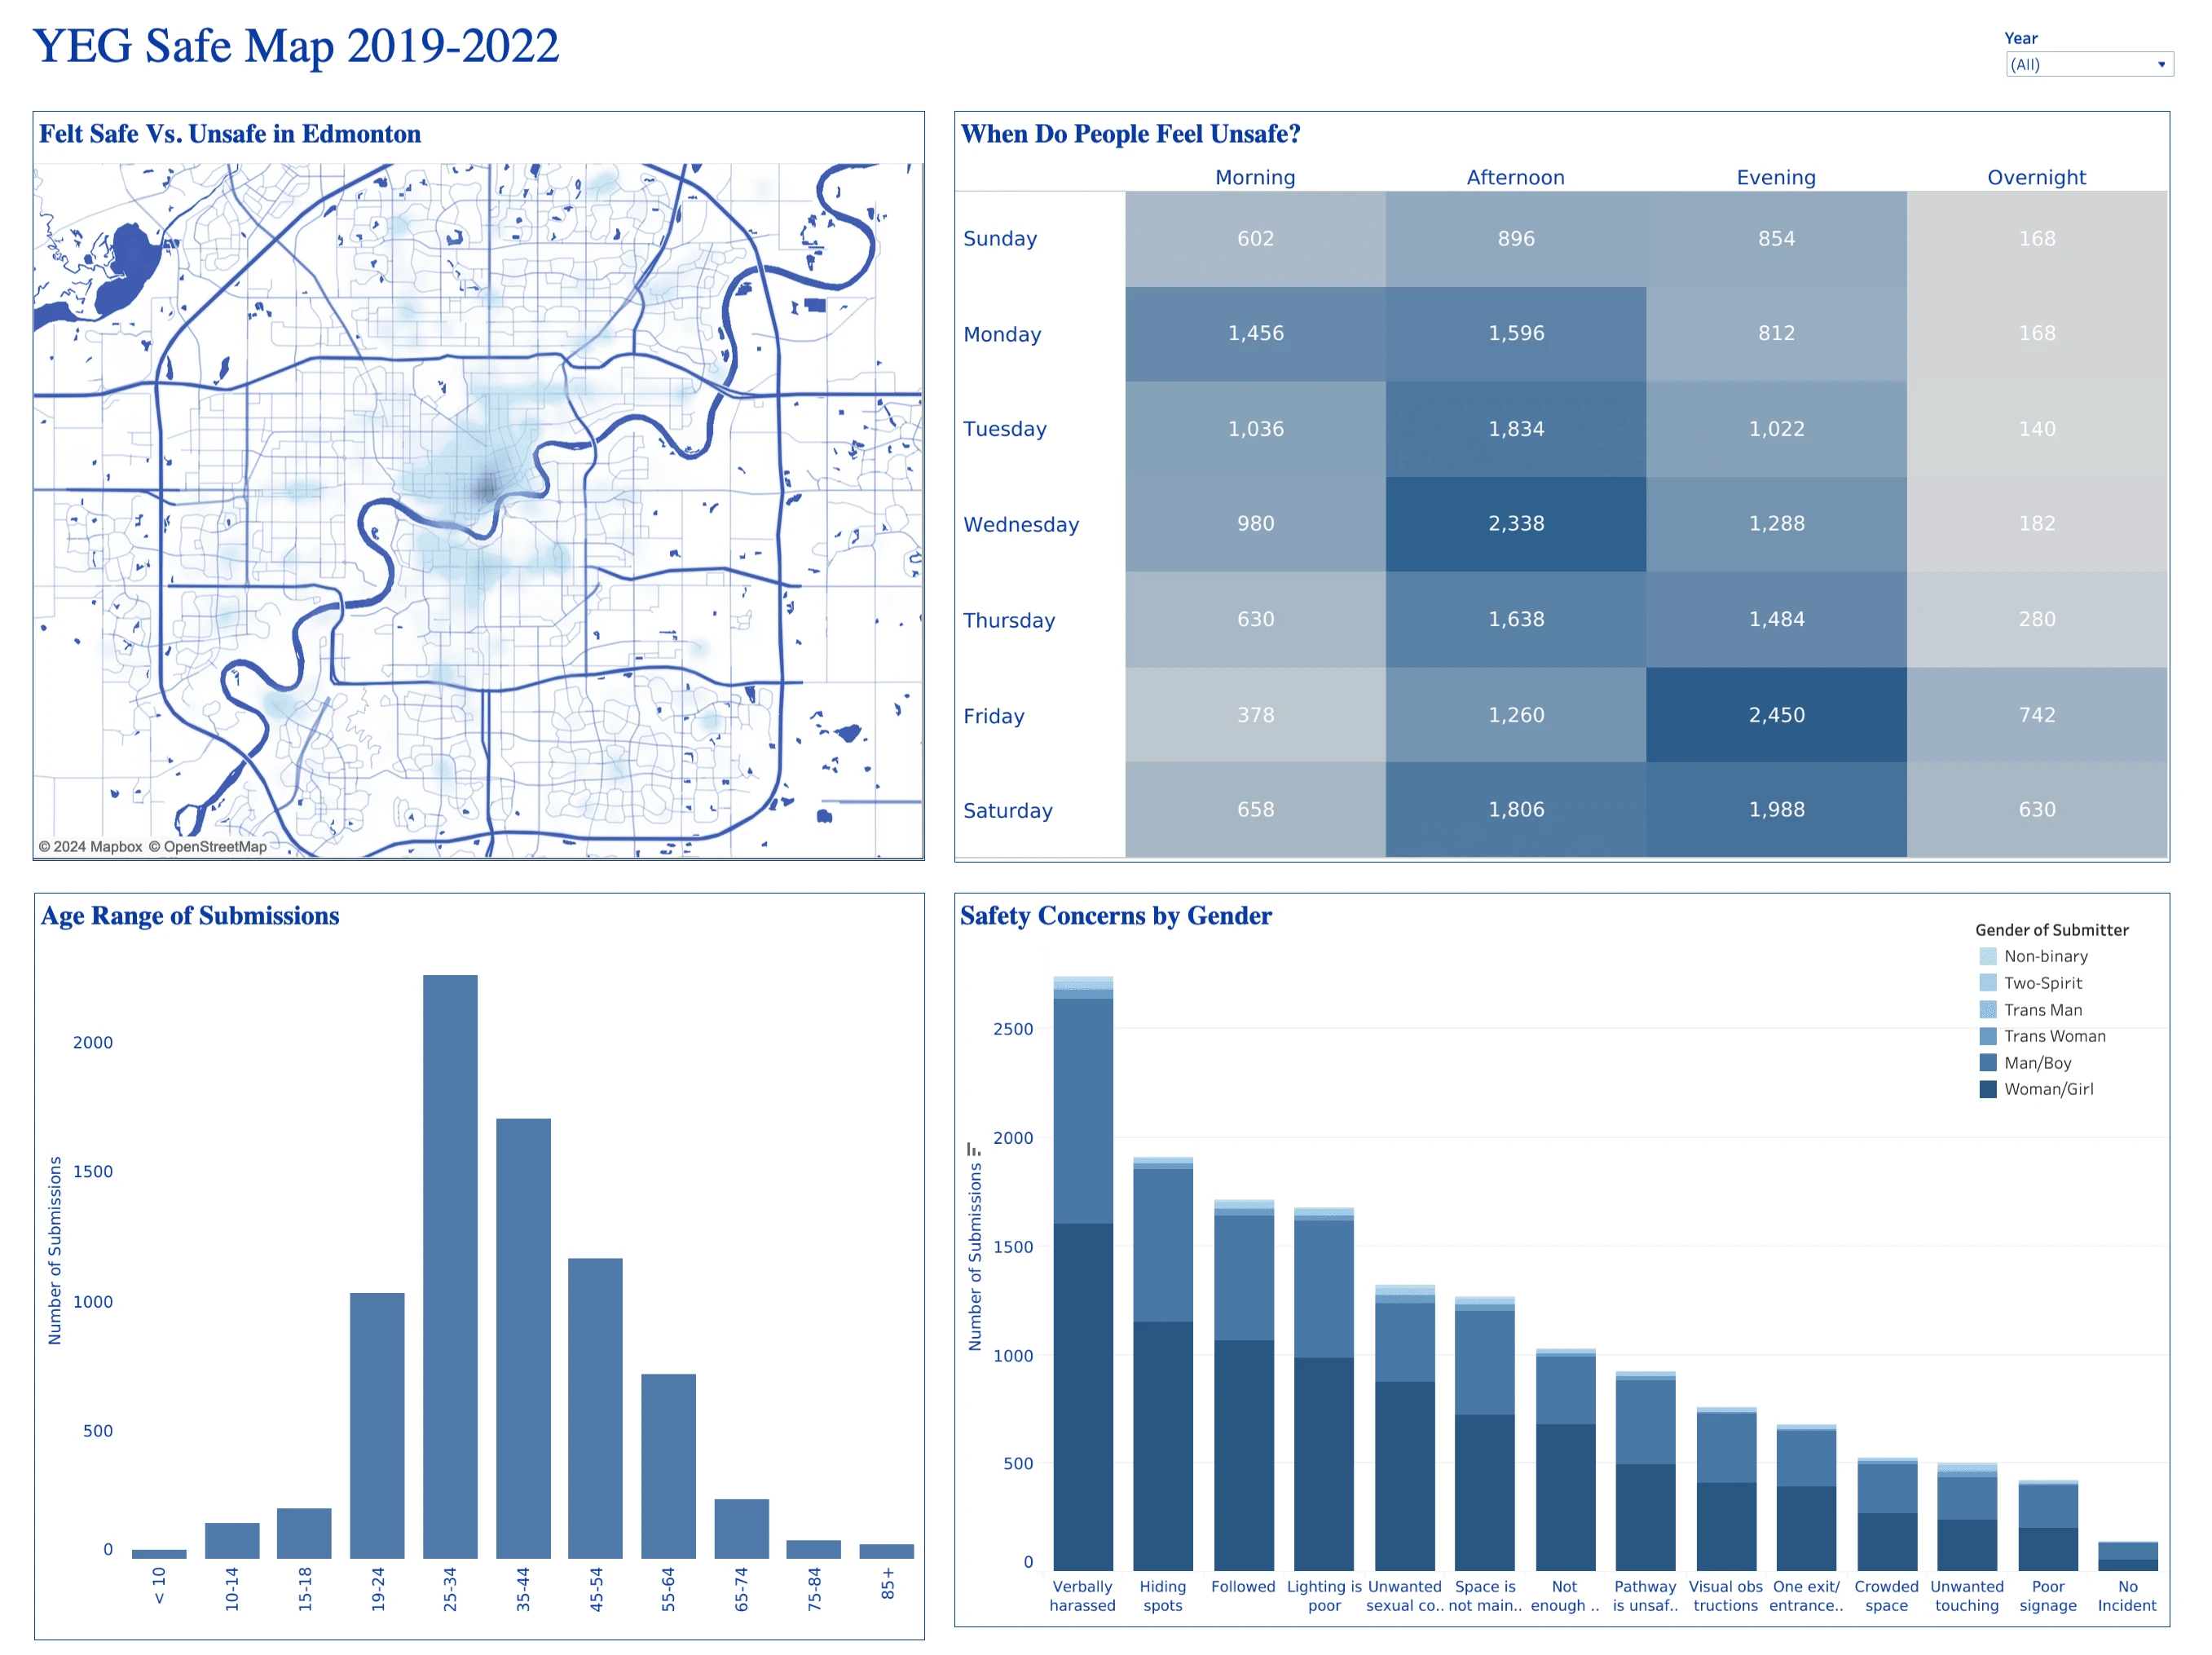
An interactive Tableau dashboard to assess and visualize the perceived safety in various locations across the city of Edmonton. The data was gathered from the open data portal provided by the city of Edmonton, containing valuable insights regarding safety perceptions shared by the citizens. The dashboard also incorporates interactivity, allowing users to filter visualizations based on factors affecting safety and explore the data in more detail. This project is valuable for city planners, law enforcement, and community members, enabling them to identify areas in need of improvement and work towards creating a safer urban environment.
Like this project
Posted Sep 26, 2024
Tableau dashboard highlighting where people feel unsafe in the city. Categorizes complaints by time of the day, age, and gender.
Likes
0
Views
7