


Join the $20k Squarespace Challenge
It’s time to make it real. Enter for a chance to win $20k in prizes. Learn more.


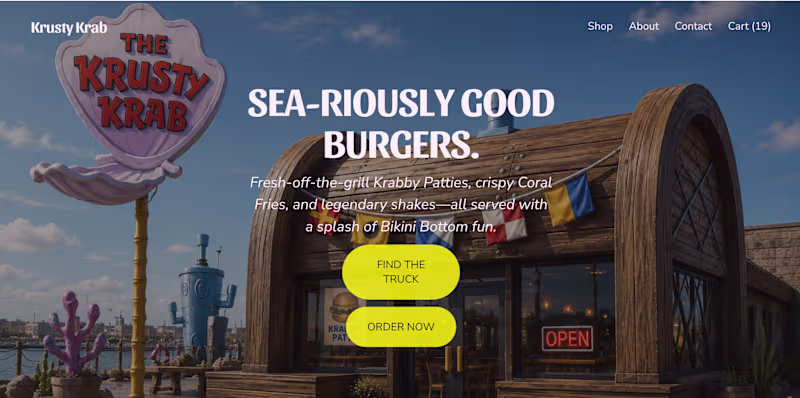
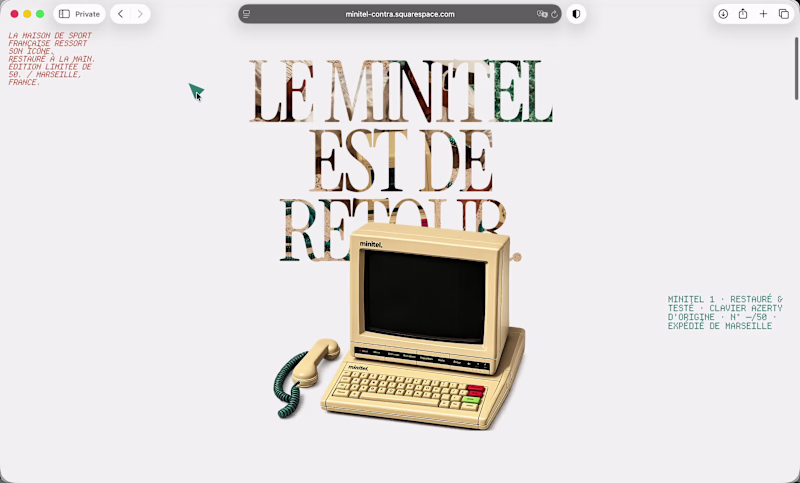
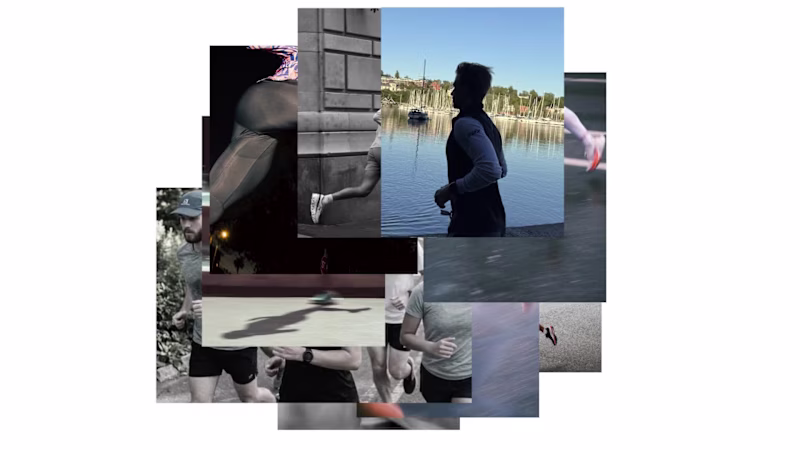
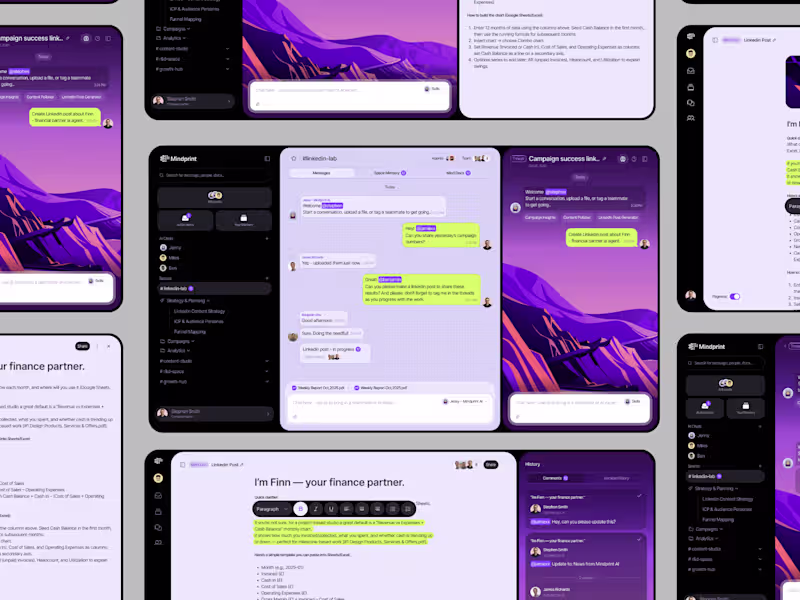
Web design projects using Framer
Framer
The best modern websites built on the leading web design tool, Framer
Framer is the leading tool for building websites, fast


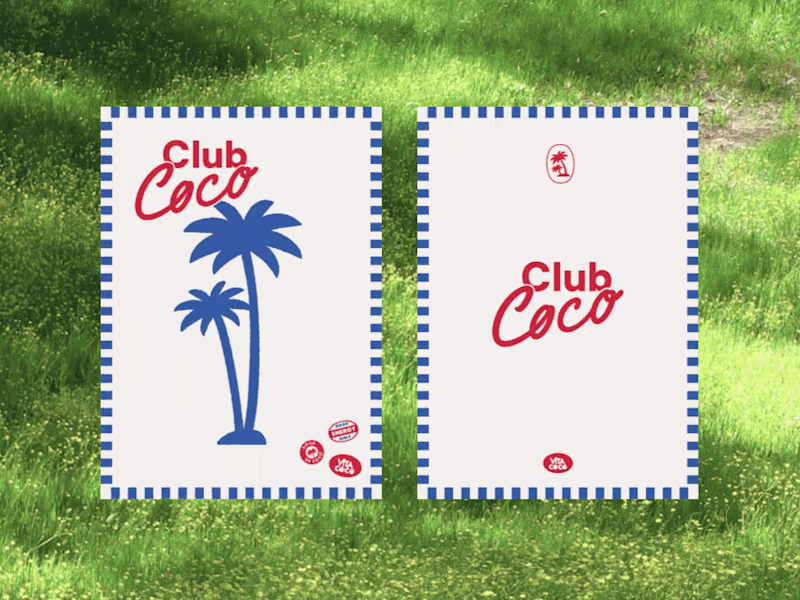
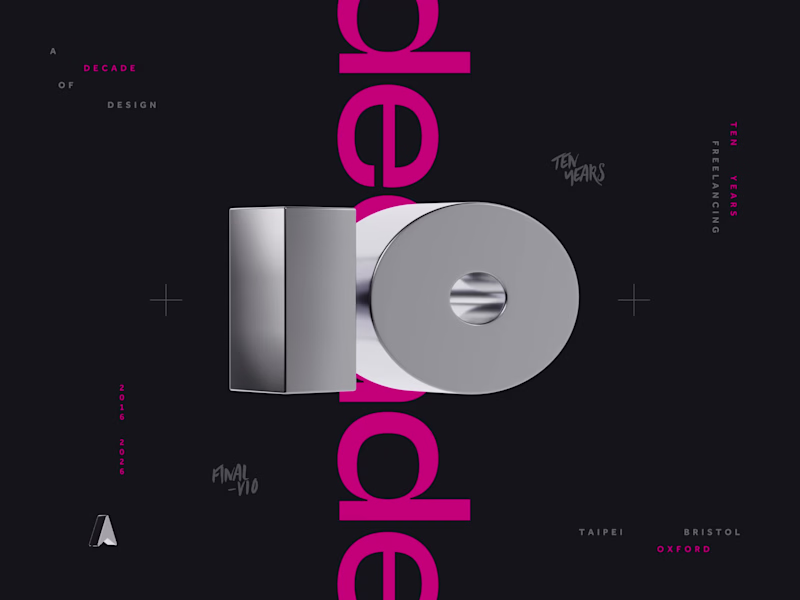
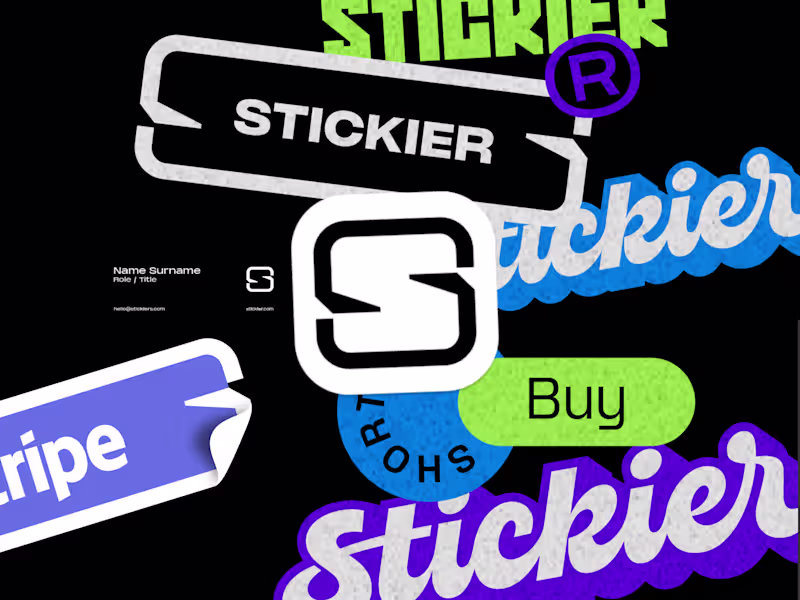
Brand design projects
Brand design
Bold visual identities and branding systems created by top independent designers


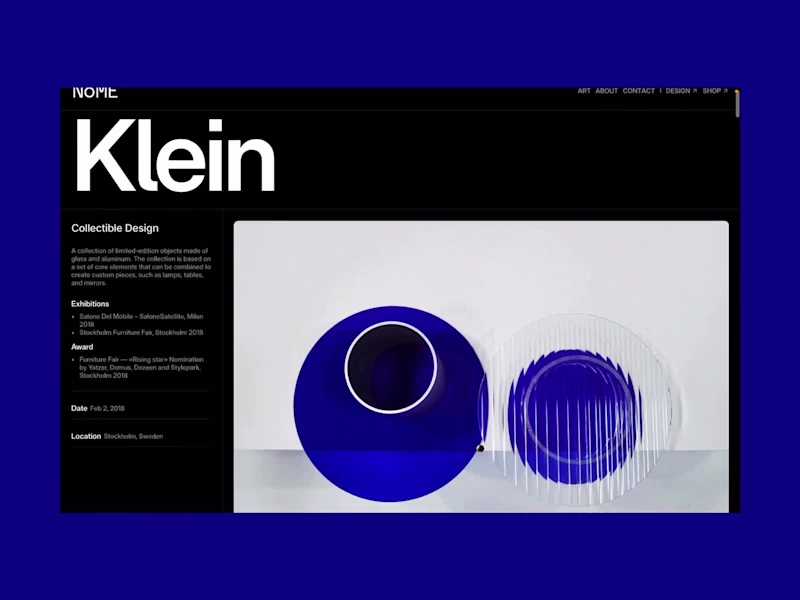
Standout projects
Standout projects
More projects we love that are making waves across the web