Bottom left hero backgroundTop right hero background

Best freelance Data Visualizers for Text Analytics to hire in 2025

Looking to hire Data Visualizers for your next Text Analytics project? Browse the world’s best freelance Data Visualizers for Text Analytics on Contra.

Trusted by 50K+ teams from creative agencies to high growth tech companies

Logo for Wix StudioLogo for RiveLogo for WebstudioLogo for GlorifyLogo for JitterLogo for FlutterFlowLogo for PeachWebLogo for CanvaLogo for Lottie FilesLogo for Workshop BuiltLogo for BuildshipLogo for AppsumoLogo for FramerLogo for BarrelLogo for BubbleLogo for LummiLogo for WebflowLogo for GrayscaleLogo for Stride UXLogo for InstantLogo for SplineLogo for KittlLogo for RelumeLogo for HeyGenLogo for Replo
FAQs

What key skills should you look for when hiring a data visualizer?

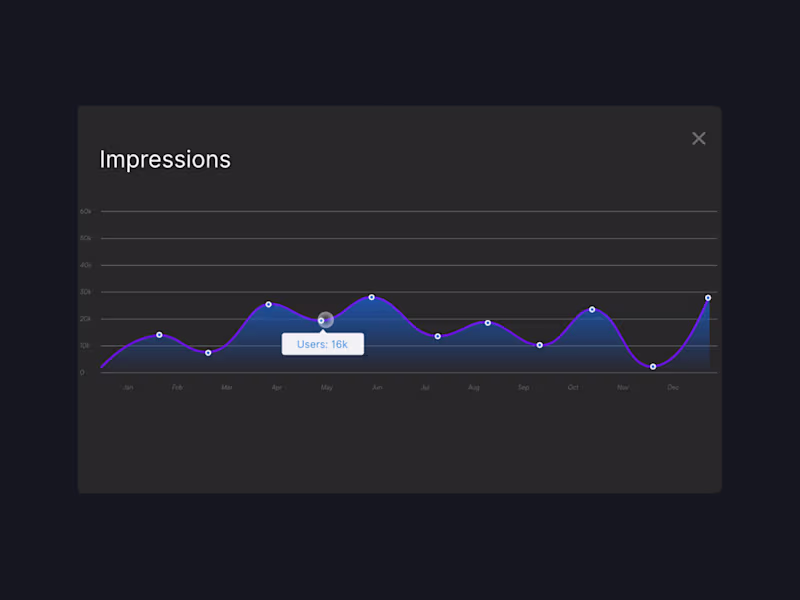
Look for someone who knows how to use data visualization tools like Tableau or Power BI. They should also be good at making charts and graphs that are easy to understand. A great data visualizer can turn boring numbers into interesting stories.

How should you describe your project to a freelance data visualizer?

Tell them what data you have and what story you want to tell with it. Be clear about the goals you want to achieve with the visualizations. This helps the freelancer create something that matches your vision perfectly.

What portfolio pieces are important to review?

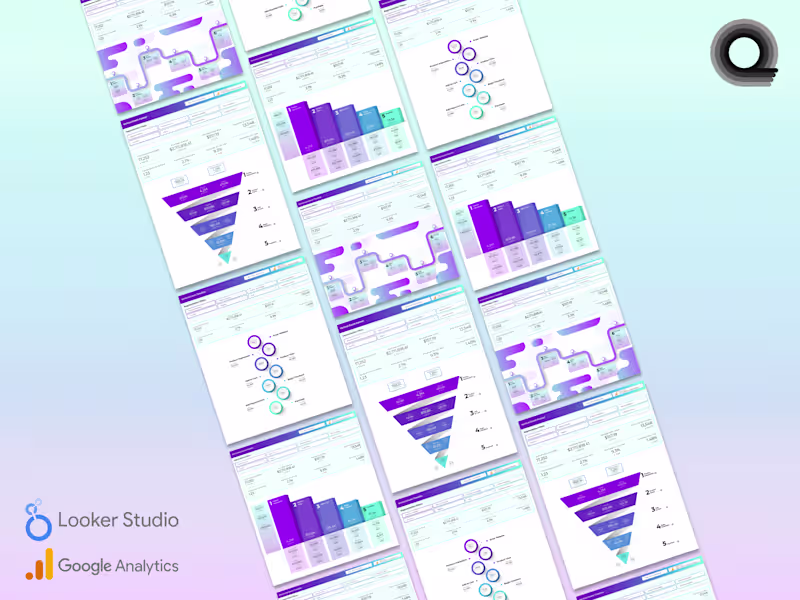
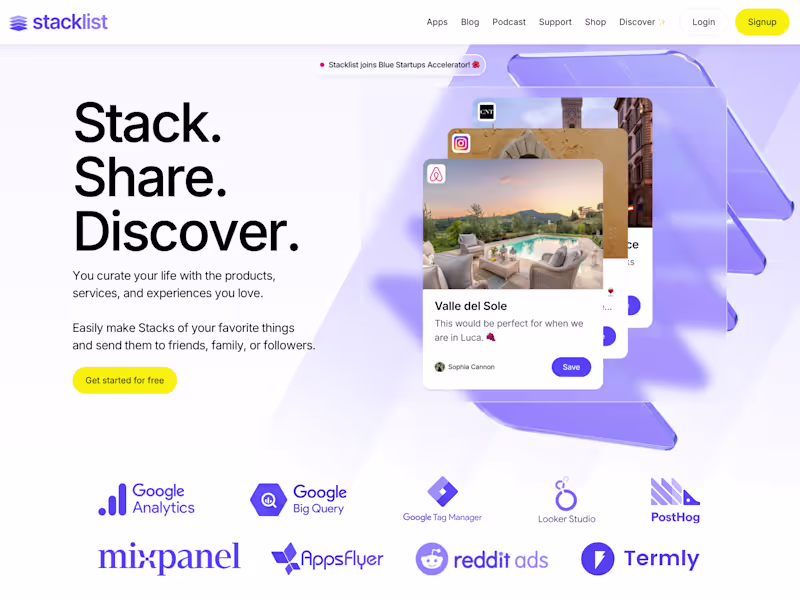
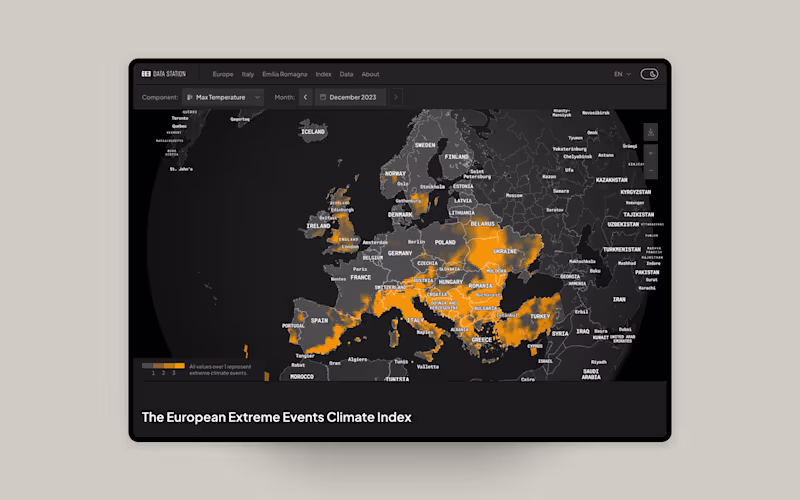
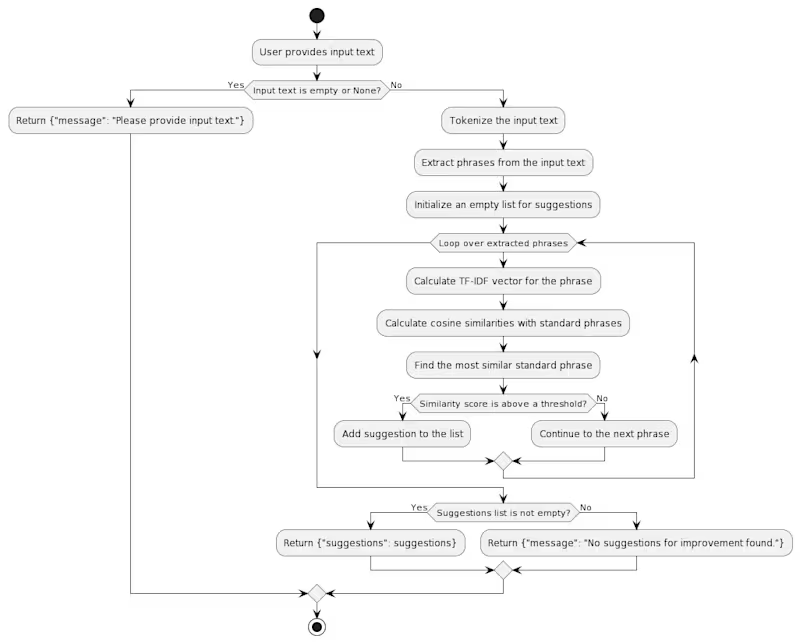
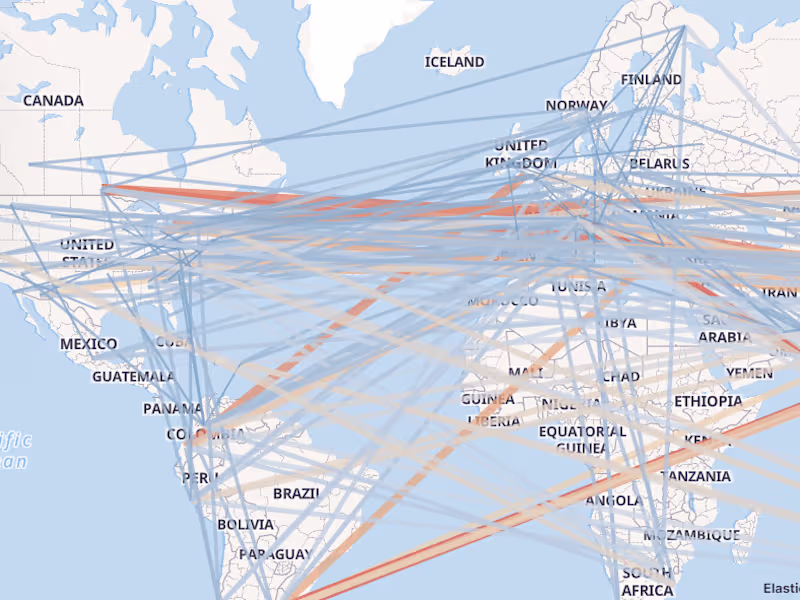
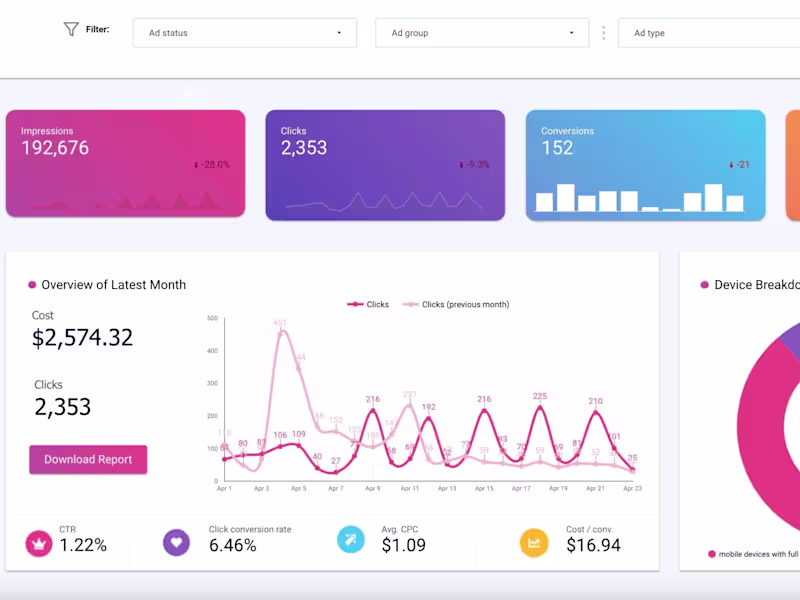
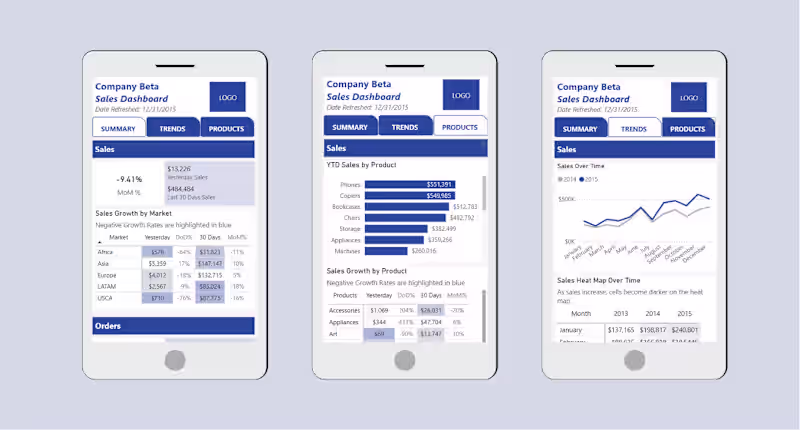
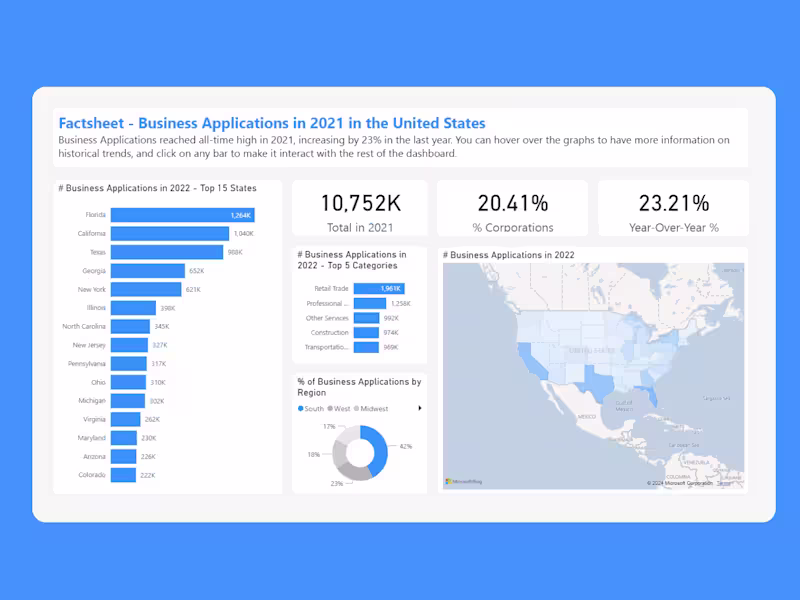
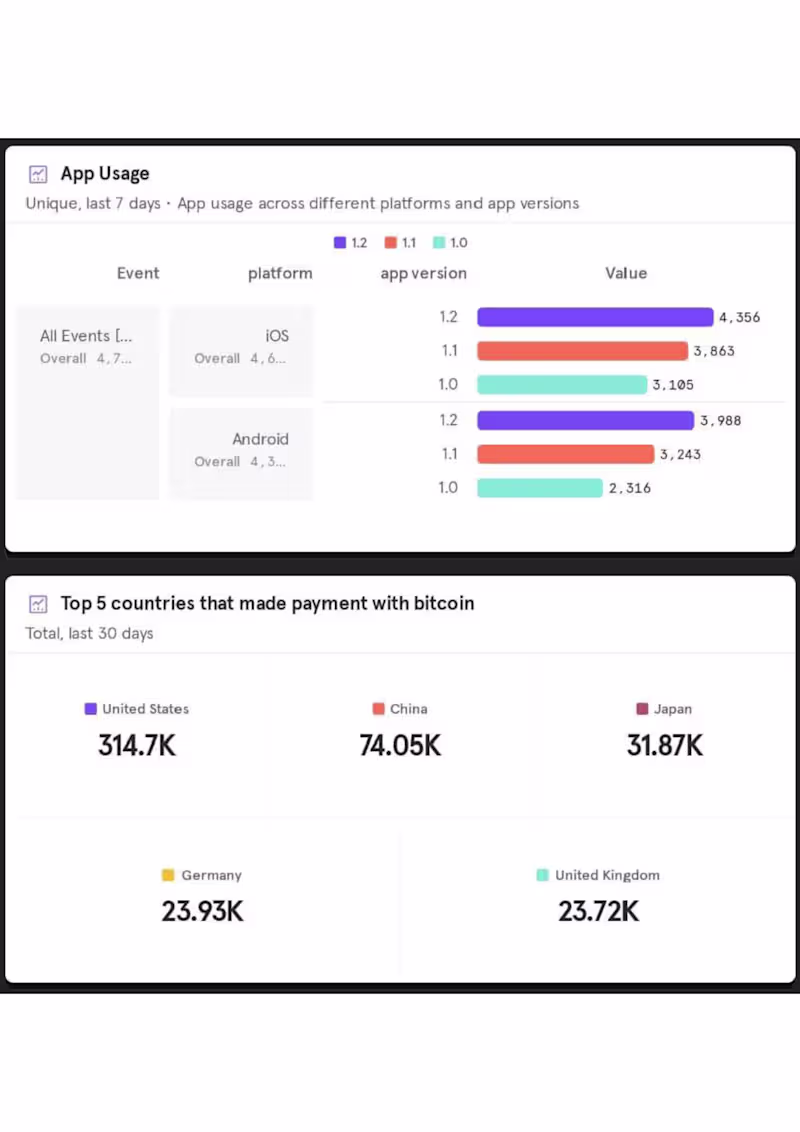
Check if they have examples of visualizations similar to what you want. Look for charts, infographics, and dashboards that demonstrate their style. This will show you if their work fits the aesthetic and complexity you need.

How do you agree on project deliverables with a data visualizer?

Make a list of all the visuals you need, like graphs or charts. Set a timeline for when each piece should be completed. Agreeing on these things ahead of time avoids misunderstandings.

What tools should a data visualizer use for your project?

Discuss the software or tools they plan to use. Make sure they are compatible with what you have or can easily be shared. This keeps everything organized and easy to update if needed.

Why is storytelling important in data visualization?

Storytelling helps people understand the data by making it relatable. A good visual story captures the audience's attention and keeps them engaged. It makes complex data easy to digest and remember.

How important is it for a data visualizer to understand your industry?

It's good if they know the common data trends in your field. This helps them create visuals that are accurate and insightful. Familiarity with the industry ensures they will add value to the project.

What should be included in the initial project meeting?

Discuss the project's goals, timelines, and specific visualizations needed. Make sure both of you understand the project outline. This meeting sets the tone and direction for the entire project.

How can you ensure effective communication throughout the project?

Set up regular check-ins to discuss progress and changes. Use a platform that allows easy sharing of updates and feedback. Keeping communication lines open ensures the project stays on track.

Who is Contra for?

Contra is designed for both freelancers (referred to as "independents") and clients. Freelancers can showcase their work, connect with clients, and manage projects commission-free. Clients can discover and hire top freelance talent for their projects.

What is the vision of Contra?

Contra aims to revolutionize the world of work by providing an all-in-one platform that empowers freelancers and clients to connect and collaborate seamlessly, eliminating traditional barriers and commission fees.
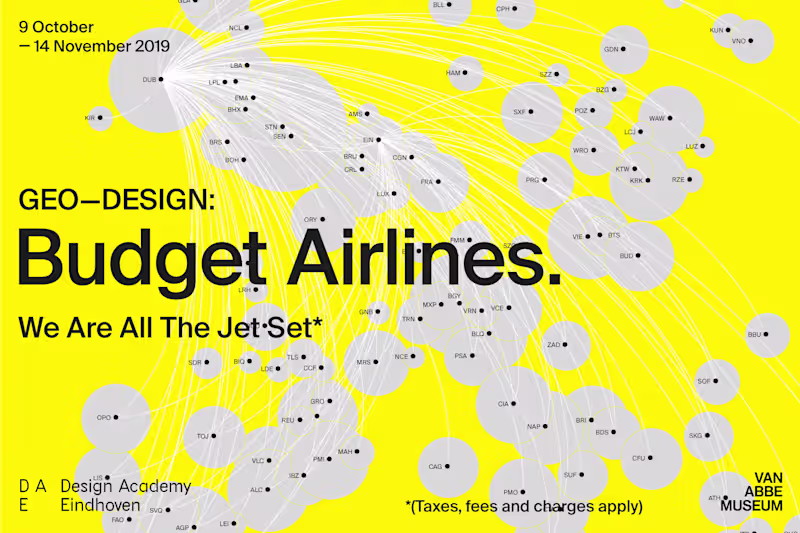
AI Campaign Assets + Agents for DTC Growth
$25k+
Earned
32x
Hired
5.0
Rating
135
Followers
Analytics(1)
AI Agents Architect | Data Analyst | Database Specialist
$25k+
Earned
9x
Hired
5.0
Rating
46
Followers
Analytics(2)
Data-Driven Solutions with Developer Precision
$5k+
Earned
1x
Hired
5.0
Rating
24
Followers

People also hire

Explore Text Analytics projects by Data Visualizers on Contra

Cover image for Bank Customer Churn EDA
Bank Customer Churn EDA
0
39
Cover image for Online Grocery Big Data Trends
Online Grocery Big Data Trends
1
28
Cover image for Diabetes Predictive Model
Diabetes Predictive Model
0
18
Cover image for Ranger Rank
Ranger Rank
0
24
Cover image for Data Analytics | MARTECH Expert
Data Analytics | MARTECH Expert
0
63
Cover image for Text Summary Tool powered by Bard AI
Text Summary Tool powered by Bard AI
0
56
Cover image for Identity and data visualization for an exhibition
Identity and data visualization for an exhibition
1
39
Cover image for Zoom in/ Zoom out animation chart in Rive
Zoom in/ Zoom out animation chart in Rive
3
381
Cover image for App Developed for World Data | Data Analysis and Visualization
App Developed for World Data | Data Analysis and Visualization
0
185
Cover image for Unlocking the Formula for Successful Videos on YouTube
Unlocking the Formula for Successful Videos on YouTube
0
19
Cover image for Dashboard for climate data
Dashboard for climate data
1
47
Cover image for Text Improvement Engine
Text Improvement Engine
0
19
Cover image for Flights Data Visualization in Power BI Integrated with SQL
Flights Data Visualization in Power BI Integrated with SQL
1
78
Cover image for BI Dashboard | Google Analytics | Google Data Studio
BI Dashboard | Google Analytics | Google Data Studio
1
79
Cover image for Wendy's - Power BI Mobile App
Wendy's - Power BI Mobile App
1
159
Cover image for Transforming Complex Census Data into Actionable Insights
Transforming Complex Census Data into Actionable Insights
2
72
Cover image for Custom Invoicing Solution with Microsoft Paginated Reports
Custom Invoicing Solution with Microsoft Paginated Reports
1
56
Cover image for Reddington Family Care
Reddington Family Care
0
80
Cover image for Anike Bridge Profit Analysis
Anike Bridge Profit Analysis
2
152
Cover image for Women in Tech
Women in Tech
2
58
Cover image for Airlines Flights Data Visualization in Power BI Integrated with
Airlines Flights Data Visualization in Power BI Integrated with
3
87
Cover image for Sales Data Analysis & Data Visualization in Power BI
Sales Data Analysis & Data Visualization in Power BI
2
131
Cover image for KPI Tracking in Plecto | Live TV Dashboards
KPI Tracking in Plecto | Live TV Dashboards
1
128
Cover image for People Activity Data Visualization Elasticsearch Kibana
People Activity Data Visualization Elasticsearch Kibana
2
112
Cover image for 💓 Heart Data | 3D Rendering and Data Visualization💓
💓 Heart Data | 3D Rendering and Data Visualization💓
0
11
Cover image for ETL + OpenCV + Scikit-learn (AI COVID-19 Data Analysis)
ETL + OpenCV + Scikit-learn (AI COVID-19 Data Analysis)
2
39
Cover image for Customer Insights
Customer Insights
0
33
Cover image for SaaS Development Replit
SaaS Development Replit
3
230
Cover image for [Case Studies] How I helped startups with product growth
[Case Studies] How I helped startups with product growth
0
29
Cover image for Transforming Marketing Insights with GA4
Transforming Marketing Insights with GA4
1
39
Cover image for Google Analytics Looker Studio Dashboards
Google Analytics Looker Studio Dashboards
1
60
Cover image for HP DevOne Product Launch Marketing Spend Looker Dashboards
HP DevOne Product Launch Marketing Spend Looker Dashboards
1
24
Cover image for Optum Annual Clinician Forum Looker Studio Reports
Optum Annual Clinician Forum Looker Studio Reports
1
20
Cover image for TIBCO Analytics Forum Looker Studio Dashboards
TIBCO Analytics Forum Looker Studio Dashboards
1
22
Cover image for DELL Virtual Dev Conference Analytics Looker Studio Dashboard
DELL Virtual Dev Conference Analytics Looker Studio Dashboard
1
14
Cover image for Analytics at CRED
Analytics at CRED
0
18
Cover image for Analytics at SHEROES
Analytics at SHEROES
1
5
Cover image for Complaion – Streamlining ISO Certification
Complaion – Streamlining ISO Certification
25
522
Cover image for Ivorypay - Crypto payment gateway
Ivorypay - Crypto payment gateway
1
6
Cover image for Power BI Inventory Control Dashboard for Efficient Stock Managem
Power BI Inventory Control Dashboard for Efficient Stock Managem
0
67
Cover image for Custom Power BI Sales Analytics Dashboard
Custom Power BI Sales Analytics Dashboard
0
25
Cover image for Real-Time Truck Fleet Monitoring Dashboard
Real-Time Truck Fleet Monitoring Dashboard
1
31
Cover image for BI Specialist for Meta Ads Dashboard Integration
BI Specialist for Meta Ads Dashboard Integration
2
90
Cover image for Data Visualisation For Bright Data
Data Visualisation For Bright Data
1
27
Cover image for How to Tell Stories with Data
How to Tell Stories with Data
0
11

Top services from Data Visualizers on Contra

Top locations for Data Visualizers for Text Analytics

Data Visualizers for Text Analytics near you

Cover image for FactRevolution Website Redesign
FactRevolution Website Redesign
0
3
Cover image for DCF Valuation Tools!
DCF Valuation Tools!
0
3