ETL + OpenCV + Scikit-learn (AI COVID-19 Data Analysis)
Amin Dhouib
COVID Data Analysis
Executed data science and machine learning methods to analyze the COVID-19 data (change in commute, number of hospital visits, etc.) using PostgreSQL to store the data and Pandas, NumPy, scikit-learn and OpenCV to process the data.
Data Mining
Firstly, I performed some data mining to access data that can help me analyze COVID-19 Data, such as weather, transportation, and hospital cases, from various sources.
Data Staging
Secondly, data staging normalized the gathered data and created SQL DBs.
Data Visualization & Feel
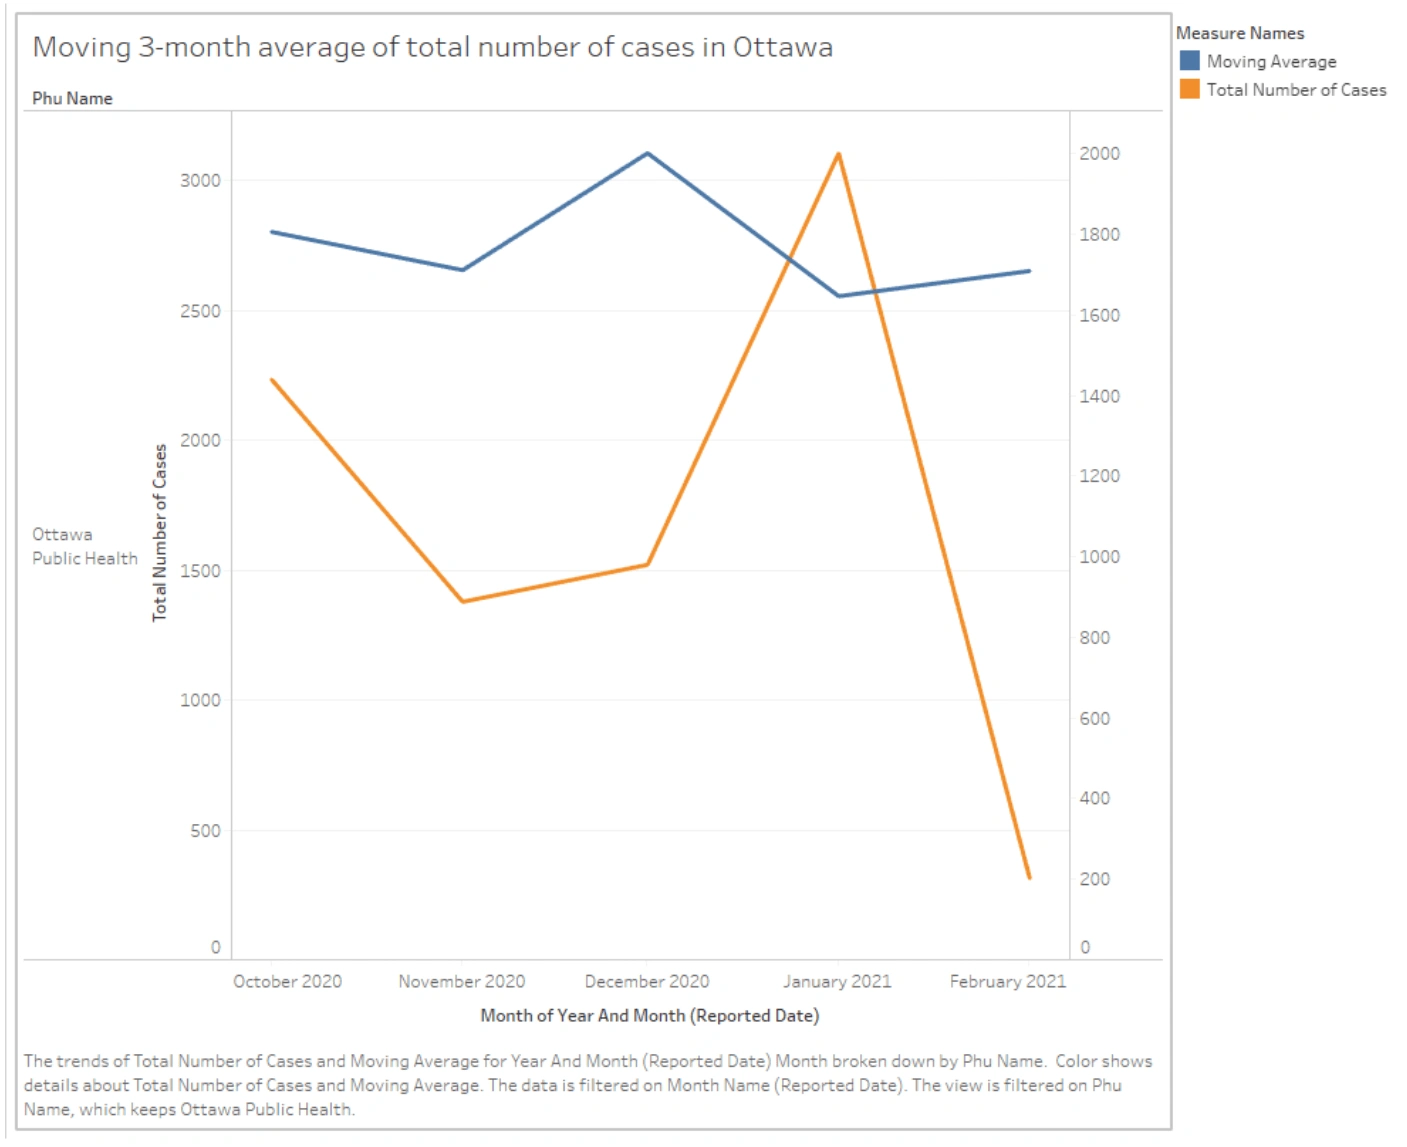
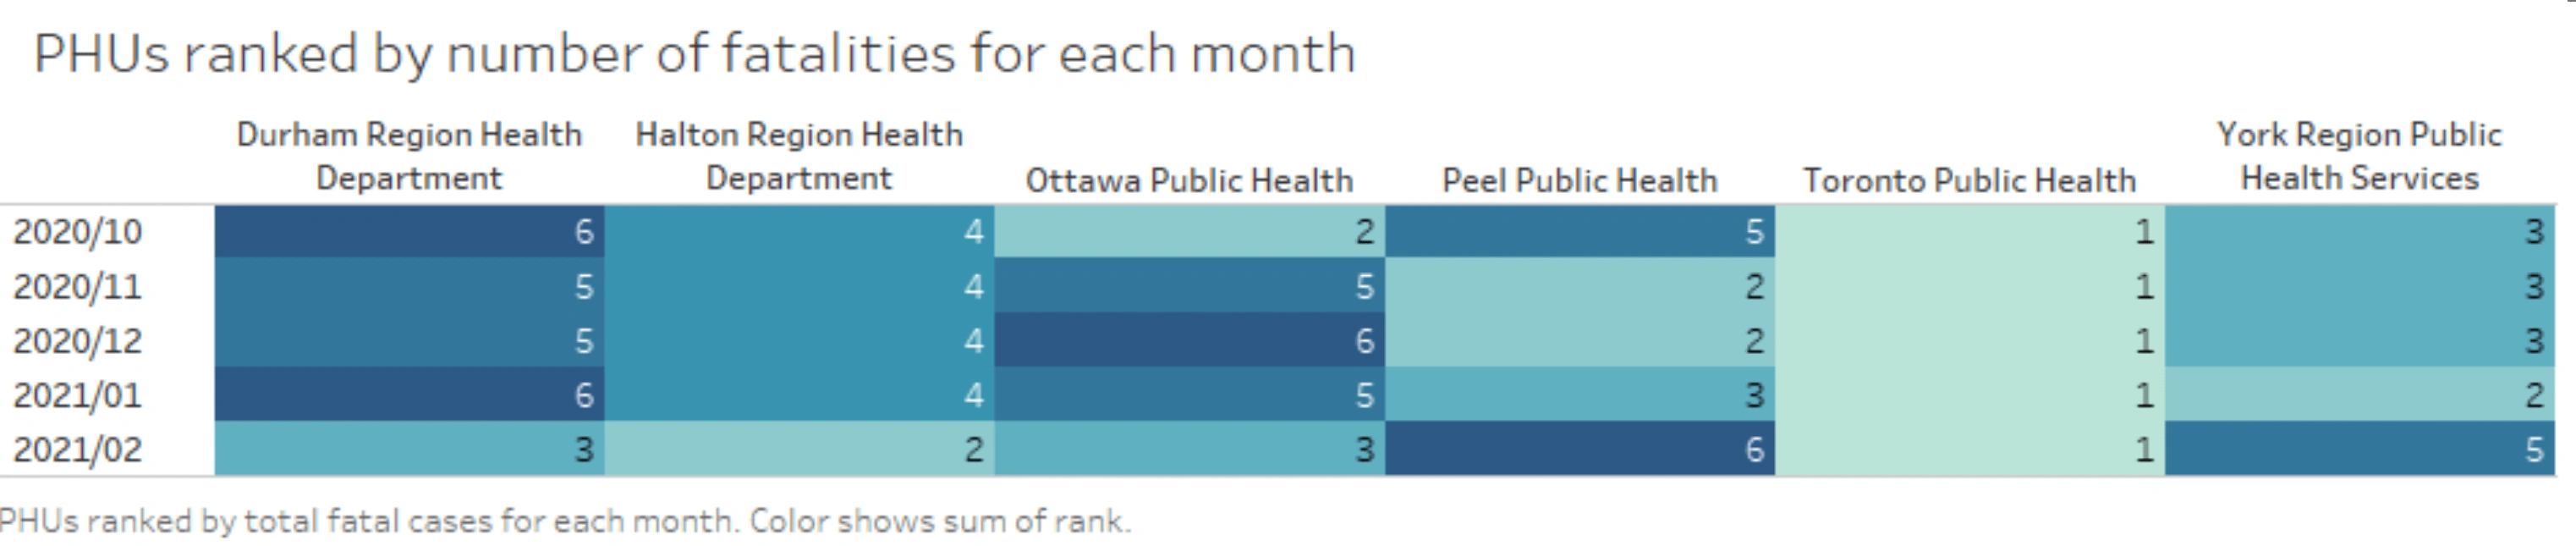
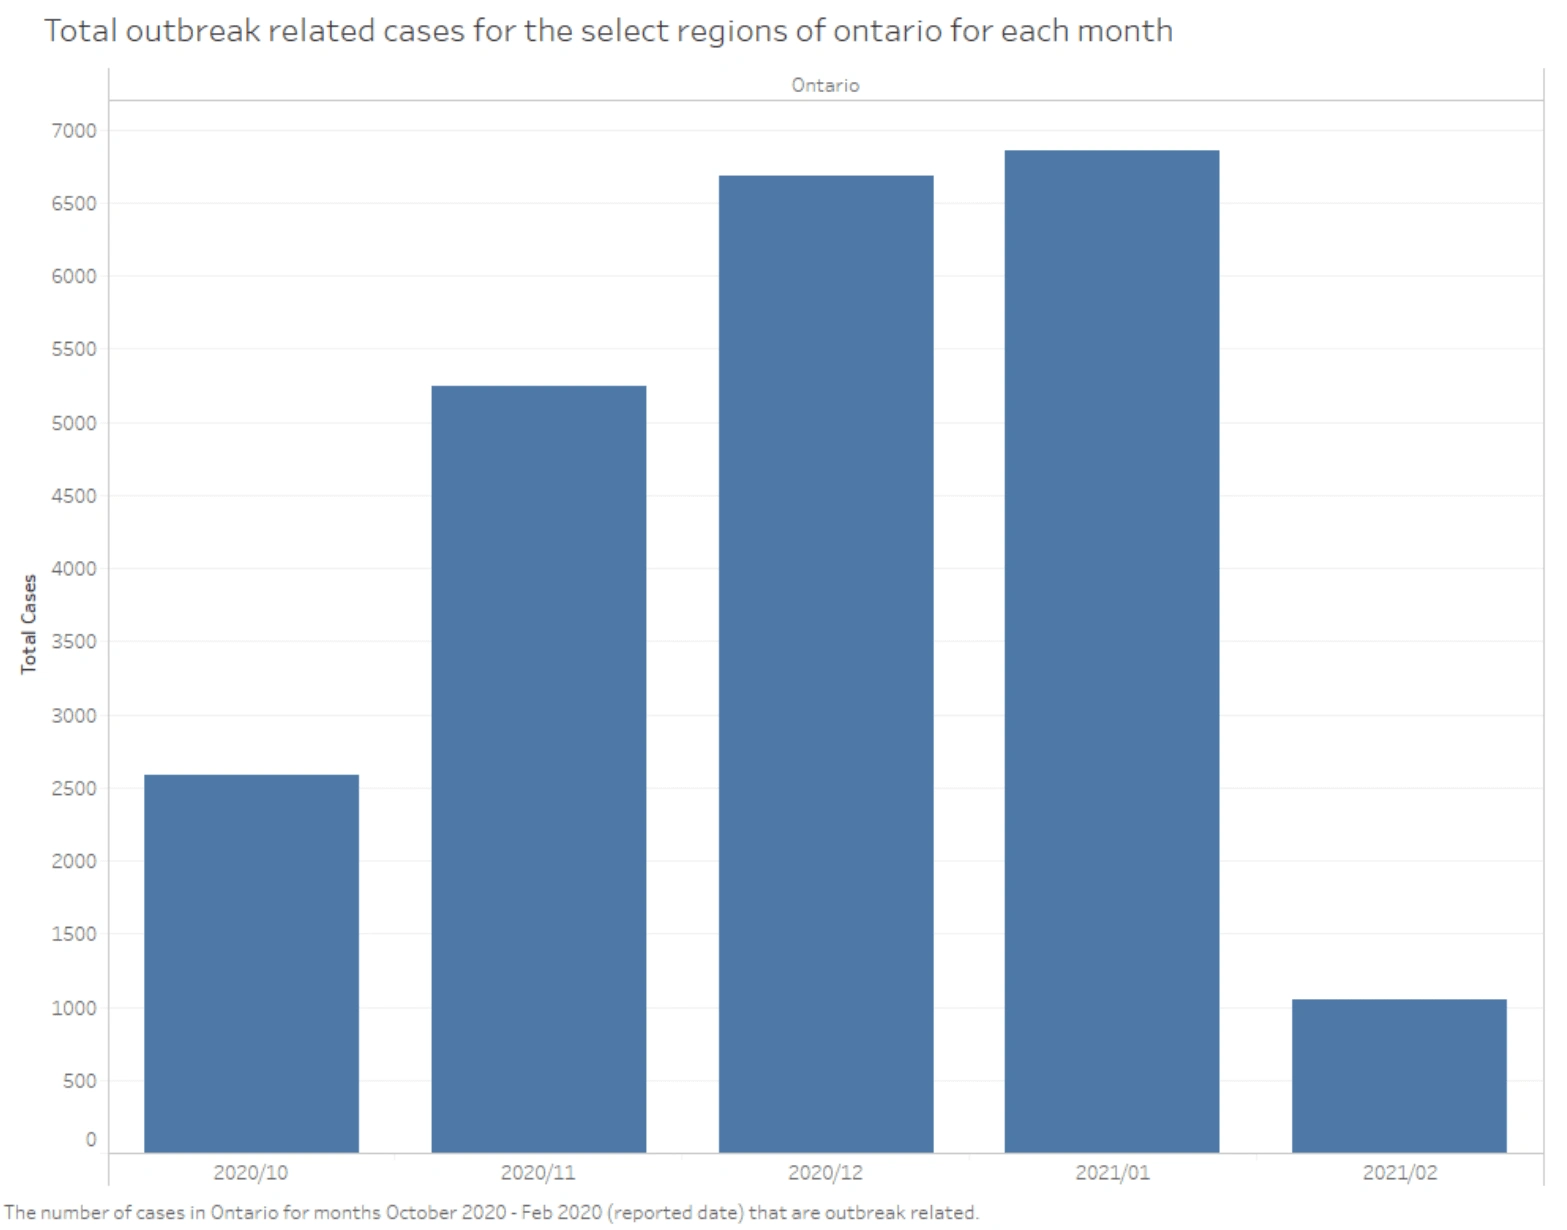
Third, relevant SQL queries should be created to give a feel for the data.
For example, the query below gives you the number of cases in Ottawa and Toronto grouped by quarter and drilled down to months of the year during workplace closure, restrictions on gatherings, and stay-at-home order periods.
Here are all of the queries I tried to get a feel of the data in the following link: https://docs.google.com/document/d/1eihbuxC4YZpmtLb3oDhYONP5leG3y1_6hwXBLrquEDI/edit?usp=sharing The document also includes a dashboard created using Tableau to visualize the data.
Data Analysis With AI
With the gathered data, we built unsupervised machine-learning models using scikit-learn and OpenCV to discover patterns and insights.
Like this project
Posted Aug 24, 2024
Executed data science and machine learning methods to analyze the COVID-19 data (change in commute, number of hospital visits, etc.).
Likes
2
Views
55