Bottom left hero backgroundTop right hero background

Best English-speaking freelance Data Visualizers to hire in 2025

Looking to hire English-speaking Data Visualizers for your next project? Browse the world’s best freelance Data Visualizers on Contra.

Trusted by 50K+ teams from creative agencies to high growth tech companies

Logo for Wix StudioLogo for RiveLogo for WebstudioLogo for GlorifyLogo for JitterLogo for FlutterFlowLogo for PeachWebLogo for CanvaLogo for Lottie FilesLogo for Workshop BuiltLogo for BuildshipLogo for AppsumoLogo for FramerLogo for BarrelLogo for BubbleLogo for LummiLogo for WebflowLogo for GrayscaleLogo for Stride UXLogo for InstantLogo for SplineLogo for KittlLogo for RelumeLogo for HeyGenLogo for Replo
FAQs

What experience should I look for in a freelance data visualizer?

Find someone who has worked on similar projects. Check their background in creating charts and graphs. They should understand data well and make it look good.

How can I ensure the data visualizer understands my project's goals?

Share a clear project brief. Explain what you want to achieve with the visuals. Talk about the message you want to convey through the data.

What tools and software should a data visualizer be familiar with?

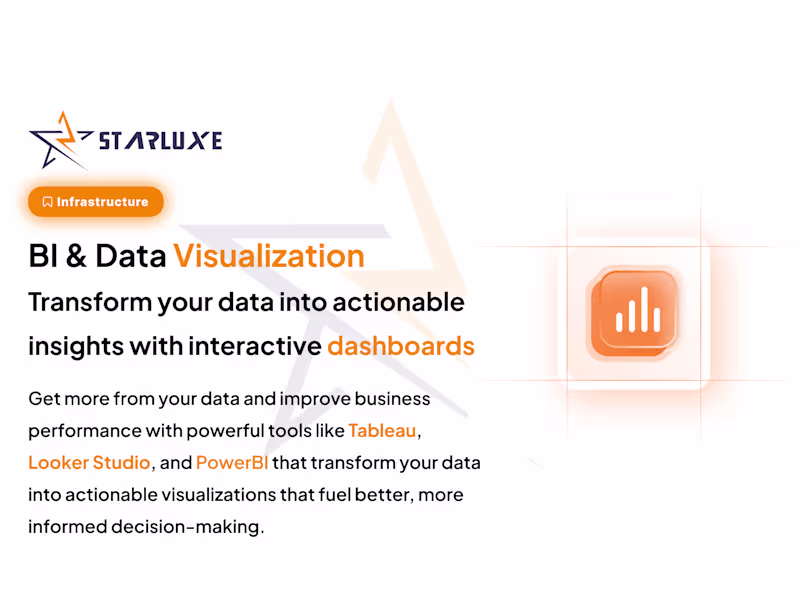
Look for someone skilled in tools like Tableau, Power BI, or D3.js. These help in creating interactive and informative visuals. The right tools make your data look great and easy to understand.

How should I discuss timelines and deadlines with the data visualizer?

Talk about when you need the project done. Break the project into smaller steps with clear due dates. Make sure they can meet your schedule needs.

What deliverables should I ask for in a data visualization project?

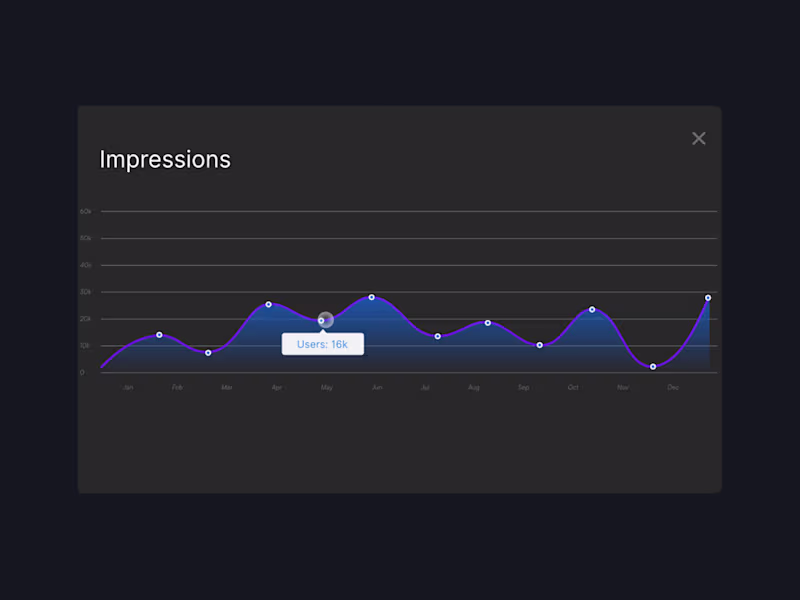
Define what you expect to receive, like charts, dashboards, or reports. Be clear on the format and style you prefer. Specify if you need interactive elements or static images.

How can I evaluate the quality of a data visualizer's previous work?

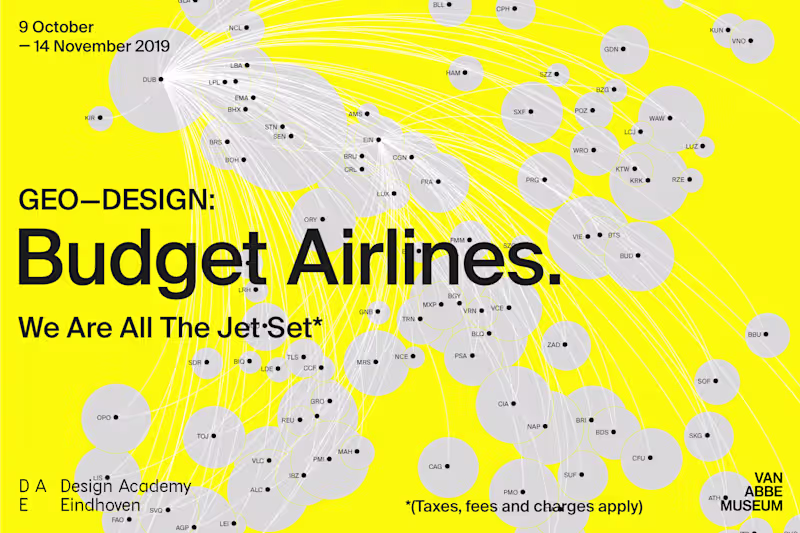
Request to see a portfolio showcasing past projects. Look for clarity, creativity, and how well complex data is simplified. This will help you gauge their ability to turn data into stories.

What is the best way to communicate feedback to a data visualizer?

Be specific about what you like or want to change. Use screenshots or examples to show your points. Keep communication open to ensure the visualizer can make necessary adjustments.

How can I align the data visualizer's work with my brand's style?

Share your brand guidelines, like colors and fonts, with the visualizer. Discuss how your brand's identity can be reflected in the visuals. This ensures consistency and familiarity in the final product.

What should I do if there are changes to the project scope?

If project details change, let the visualizer know immediately. Revisit the initial agreement to adjust the scope. Make sure all changes are documented to avoid confusion.

How can I ensure that the final visuals are easy for my audience to understand?

Consider your audience's level of data literacy with the visualizer. Discuss ways to make the information clear and engaging. Test the visuals on a small group and get feedback before full development.

Who is Contra for?

Contra is designed for both freelancers (referred to as "independents") and clients. Freelancers can showcase their work, connect with clients, and manage projects commission-free. Clients can discover and hire top freelance talent for their projects.

What is the vision of Contra?

Contra aims to revolutionize the world of work by providing an all-in-one platform that empowers freelancers and clients to connect and collaborate seamlessly, eliminating traditional barriers and commission fees.

Profile avatar
Aurelie Dussenne
PRONew York, USA
$25k+
Earned
5x
Hired
7
Followers
Cover image for Wendy's - Power BI Mobile App
Cover image for Custom Invoicing Solution with Microsoft Paginated Reports
Cover image for Transforming Complex Census Data into Actionable Insights
Placeholder project card media
View more →
Profile avatar
Cinzia Bongino
Metropolitan City of Turin, Italy
$1k+
Earned
1x
Hired
5.0
Rating
2
Followers
Cover image for VFC Report
Cover image for Dashboard for climate data
Cover image for UX/UI Design for a benefits marketplace
Cover image for Design sprint for a startup idea
Profile avatar
Cara Ellis
PROUnited Kingdom
$10k+
Earned
20x
Hired
5.0
Rating
144
Followers
TOP_INDEPENDENT

Top

Cover image for PAVOI | Social Media Content
Cover image for Sugar Skull | Brand Identity Design
Cover image for KEISH | Social Media Content
$1.5K+ earned
Cover image for Dolce | Brand Identity Design
Profile avatar
Tayyab Ali
PROPakistan
$25k+
Earned
9x
Hired
5.0
Rating
5
Followers
Cover image for Graph & Vector Database Architectire Development
Cover image for AI Voice Call Agents
Cover image for BI Specialist for Meta Ads Dashboard Integration
Cover image for People Activity Data Visualization Elasticsearch Kibana
Profile avatar
Erin Riggers
PROHouston, USA
$5k+
Earned
1x
Hired
5.0
Rating
2
Followers
Cover image for OneTrust Consulting
Cover image for Google Analytics Looker Studio Dashboards
Cover image for Transforming Marketing Insights with GA4
Cover image for TIBCO Analytics Form Looker Studio Dashboards

People also hire

Explore projects by English-speaking Data Visualizers on Contra

Cover image for Bank Customer Churn EDA
0
32
Cover image for Online Grocery Big Data Trends
0
18
Cover image for Diabetes Predictive Model
0
10
Cover image for Ranger Rank
0
12
Cover image for Data Analytics | MARTECH Expert
0
59
Cover image for UA To GA4 Analytics Migration
0
44
Cover image for Looker Studio Dashboard for your Business and Marketing Team
0
55
Cover image for B2B SaaS Product that Helps You Train an AI Model
0
63
Cover image for Identity and data visualization for an exhibition
0
33
Cover image for Zoom in/ Zoom out animation chart in Rive
2
356
Cover image for App Developed for World Data | Data Analysis and Visualization
0
177
Cover image for Unlocking the Formula for Successful Videos on YouTube
0
13
Cover image for Dashboard for climate data
0
33
Cover image for Care.net  ·  Healthcare Analytics SaaS
0
10
Cover image for Flights Data Visualization in Power BI Integrated with SQL
1
57
Cover image for BI Dashboard | Google Analytics | Google Data Studio
1
52
Cover image for Wendy's - Power BI Mobile App
0
89
Cover image for Transforming Complex Census Data into Actionable Insights
1
30
Cover image for Custom Invoicing Solution with Microsoft Paginated Reports
0
31
Cover image for Reddington Family Care
0
51
Cover image for Anike Bridge Profit Analysis
1
103
Cover image for Women in Tech
1
40
Cover image for ASK4 | Infographics and Data Visualisation
0
30
Cover image for Airlines Flights Data Visualization in Power BI Integrated with
3
51
Cover image for Sales Data Analysis & Data Visualization in Power BI
1
96
Cover image for KPI Tracking in Plecto | Live TV Dashboards
1
100
Cover image for People Activity Data Visualization Elasticsearch Kibana
1
68
Cover image for 💓 Heart Data | 3D Rendering and Data Visualization💓
0
5
Cover image for ETL + OpenCV + Scikit-learn (AI COVID-19 Data Analysis)
2
28
Cover image for Customer Insights
0
29
Cover image for CRO - Landing Page - A/B Test - Conversion Optimization
0
5
Cover image for Sales Report Dashboard on Power BI
1
88
Cover image for [Case Studies] How I helped startups with product growth
0
14
Cover image for Transforming Marketing Insights with GA4
0
6
Cover image for Google Analytics Looker Studio Dashboards
0
17
Cover image for HP DevOne Product Launch Marketing Spend Looker Dashboards
0
10
Cover image for Optum Annual Clinician Forum Looker Studio Reports
0
2
Cover image for TIBCO Analytics Form Looker Studio Dashboards
0
3
Cover image for DELL Virtual Dev Conference Analytics Looker Studio Dashboard
0
2
Cover image for AI-Powered Predictive Analytics Dashboard
0
9
Cover image for Analytics at CRED
0
12
Cover image for Analytics at SHEROES
1
4
Cover image for Complaion – Streamlining ISO Certification
3
112
Cover image for Ivorypay - Crypto payment gateway
1
2
Cover image for BI Specialist for Meta Ads Dashboard Integration
1
23
Cover image for Data Visualisation For Bright Data
1
12
Cover image for How to Tell Stories with Data
0
5

Top services from English-speaking Data Visualizers on Contra

Top locations for English-speaking Data Visualizers

English-speaking Data Visualizers near you

Cover image for Mapping Biodiversity in Chile
0
10
Cover image for Custom Generated Infographics
0
0
Cover image for Public Opinion About Police in the US
0
2
Cover image for Research Report - NRC Evaluation
0
1
Cover image for Survey Analysis - Power BI Dashboard
0
7

Join 50k+ companies and 1M+ independents

Contra Logo

© 2025 Contra.Work Inc