Transforming Complex Census Data into Actionable Insights
Aurelie Dussenne
The Problem
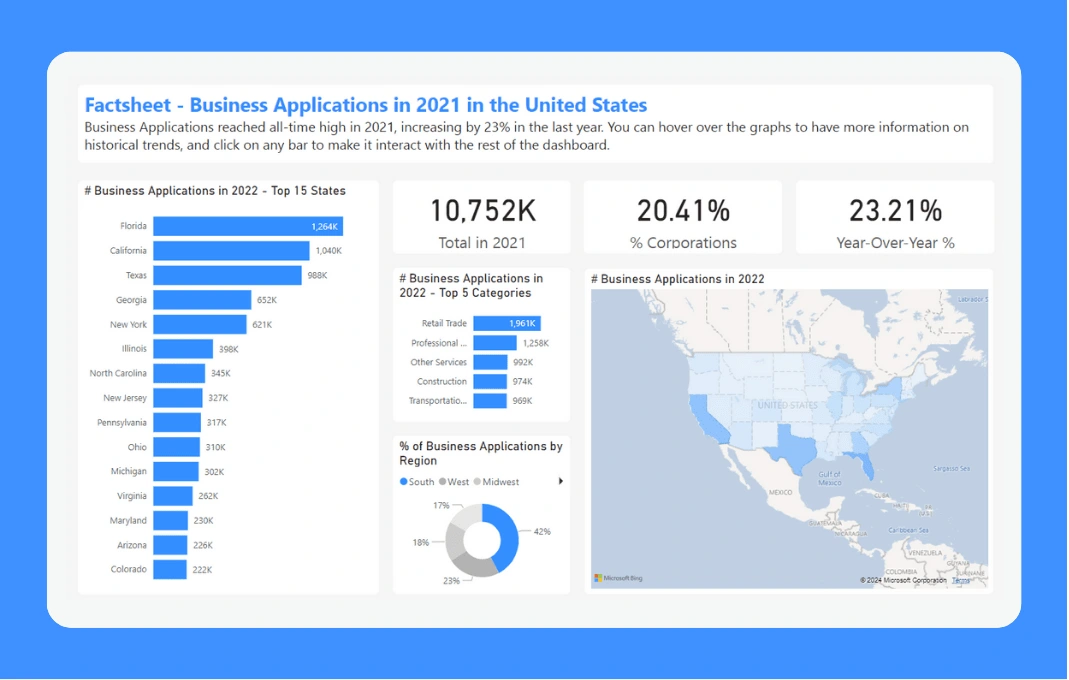
My client, a mid-sized e-commerce company, faced challenges in easily analyzing Census Data about Business Applications in the US for the year 2021. The existing data on the Census website was confusing, not user-friendly, and lacked visual representation, making it difficult for their team to derive actionable insights.
The solution
To address this, I developed an interactive and visually appealing dashboard tailored to the client's specific needs. My solution transformed the raw, complex Census data into intuitive visualizations, enabling the client's team to effortlessly explore and analyze the information.
Key Features:
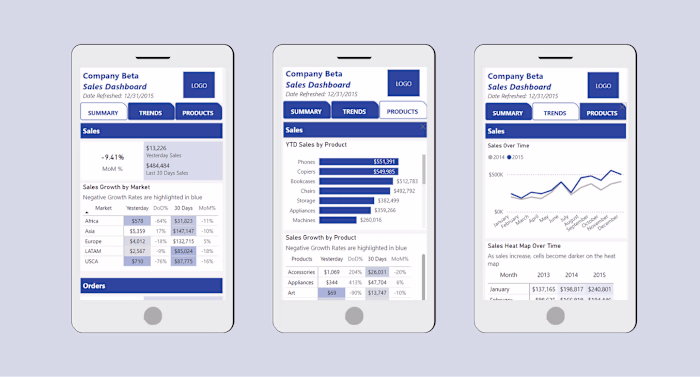
Interactive Visualizations:
Implemented dynamic charts and graphs to illustrate trends in business applications across different states and industries.
Used heat maps to show geographic distribution of new business applications, highlighting hotspots and trends over time.
User-Friendly Interface:
Designed an intuitive dashboard layout with easy-to-navigate menus and filters.
Ensured that users could drill down into specific data points, such as monthly trends or industry-specific information.
Customizable Views:
Provided options for users to customize their views, allowing them to focus on data most relevant to their analysis.
Included export functionalities for reports and visualizations in various formats (PDF, Excel, etc.).
The outcome
The implementation of the new dashboard significantly enhanced the client's ability to analyze and interpret Census data. The user-friendly, visually driven interface led to increased adoption and engagement from the team. With clear, actionable insights at their fingertips, the client was able to make informed decisions that drove business growth and strategic planning.
Like this project
Posted Jul 18, 2024
Implemented a user-friendly dashboard that boosted Census data analysis, increased team adoption, and delivered actionable insights for strategic growth.
Likes
2
Views
92