Bottom left hero backgroundTop right hero background

Best freelance Data Visualizers for Predictive Analytics to hire in 2025

Looking to hire Data Visualizers for your next Predictive Analytics project? Browse the world’s best freelance Data Visualizers for Predictive Analytics on Contra.

Trusted by 50K+ teams from creative agencies to high growth tech companies

Logo for Wix StudioLogo for RiveLogo for WebstudioLogo for GlorifyLogo for JitterLogo for FlutterFlowLogo for PeachWebLogo for CanvaLogo for Lottie FilesLogo for Workshop BuiltLogo for BuildshipLogo for AppsumoLogo for FramerLogo for BarrelLogo for BubbleLogo for LummiLogo for WebflowLogo for GrayscaleLogo for Stride UXLogo for InstantLogo for SplineLogo for KittlLogo for RelumeLogo for HeyGenLogo for Replo
FAQs

What is the main goal of our data visualization project?

It's important to know what you want to achieve with your data visualization. Are you trying to make complex data easier to understand, or are you looking to make quick decisions based on it? This will help the data visualizer understand your needs and create visuals that meet those specific goals.

How many data sets will we need analyzed and visualized?

Figuring out the number of data sets is crucial. The more data you have, the more work the freelancer will need to do. It also helps in creating a realistic timeline and scope for the project.

What software or tools do we want to use for this project?

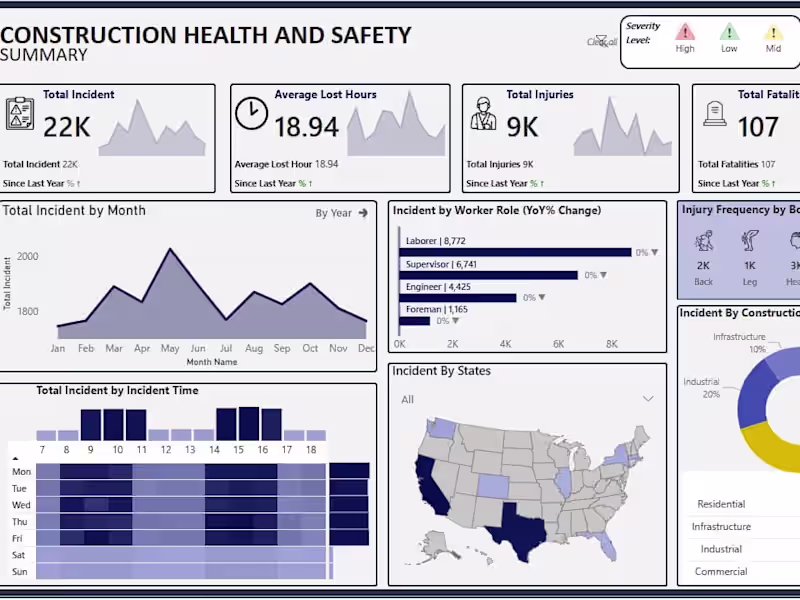
Ask yourself what tools you are comfortable with or want the final product to be made in. Some common tools include Tableau, Power BI, or Python libraries. Picking the right tool can help the data visualizer create a product that's just right for you.

How often will we need updates on progress during the project?

It's good to think about how often you want to check in on the project's progress. Regular updates can make sure everything is on track and changes can be made if needed. This helps create a smooth workflow for both you and the freelancer.

What specific insights do we wish to gain from these visualizations?

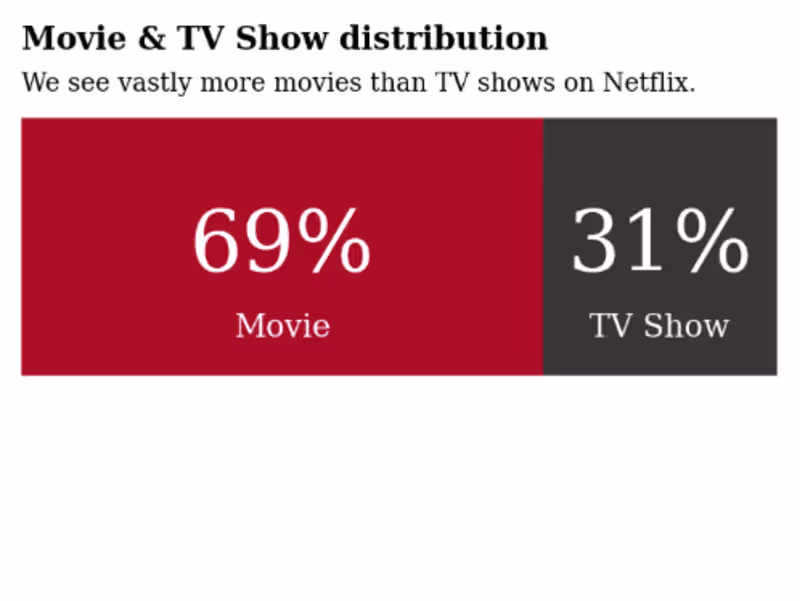
Knowing what insights you want is key. Whether it's trends, patterns, or predictions, having a clear idea will guide the data visualizer in presenting the data effectively. This makes sure the end result is helpful and matches your needs.

What timeline do we have for completing this project?

Think about how soon you need the project completed. If there's a deadline, it's important to communicate it from the start. This helps the data visualizer allocate time and resources efficiently to meet your timeline.

Do we need the data visualizer to work with other team members?

Consider if the data visualizer needs to collaborate with your team or other freelancers. Effective collaboration can lead to better results and ensures everyone is on the same page. Deciding this early on can lead to fewer surprises later.

Will the visualizations need to be updated in the future?

Think about if you want the visualizations to change as new data comes in. If they're needed long-term, discussing future updates can be good. This can guide how the visualizations are created to allow easy updates.

What format(s) do we need the final project to be delivered in?

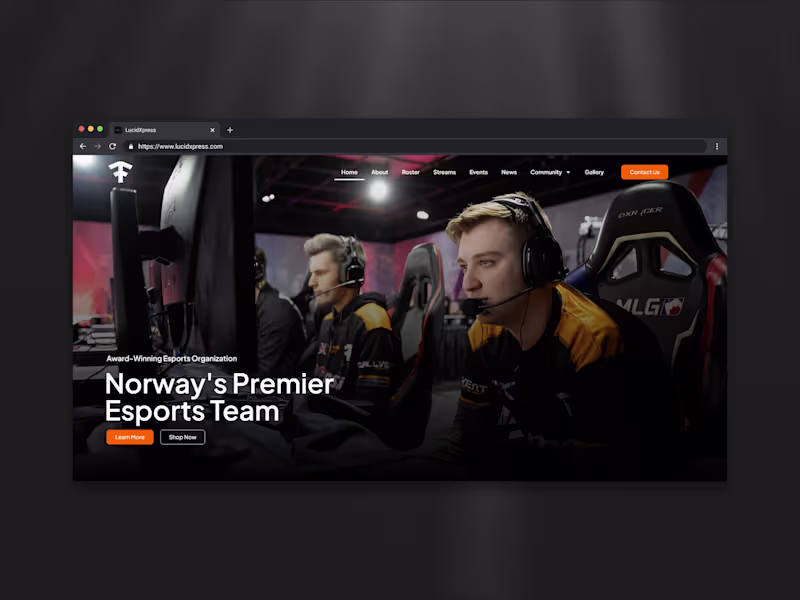
Decide on the formats you require the visualizations in, like PDF, interactive dashboards, or embedded elements for a website. Communicating this clearly allows the freelancer to deliver a product you can easily use.

Who is Contra for?

Contra is designed for both freelancers (referred to as "independents") and clients. Freelancers can showcase their work, connect with clients, and manage projects commission-free. Clients can discover and hire top freelance talent for their projects.

What is the vision of Contra?

Contra aims to revolutionize the world of work by providing an all-in-one platform that empowers freelancers and clients to connect and collaborate seamlessly, eliminating traditional barriers and commission fees.

Profile avatar
Arnaldo Matute
PROColombia
$1k+
Earned
2x
Hired
5.0
Rating
1
Followers
Cover image for Coursera: Data Analytics for Lean Six Sigma
Cover image for Contents creation for training and concept delivery
Cover image for Optimal UPS Deployment with Gurobipy
Cover image for Nuclear And Carbon
Analytics(1)
Profile avatar
Aurelie Dussenne
PRONew York, USA
$25k+
Earned
5x
Hired
8
Followers
Cover image for Transforming Complex Census Data into Actionable Insights
Cover image for Wendy's - Power BI Mobile App
Cover image for Custom Invoicing Solution with Microsoft Paginated Reports
Placeholder project card media
View more →
Analytics(1)
Profile avatar
Cara Ellis
PROUnited Kingdom
$10k+
Earned
22x
Hired
5.0
Rating
192
Followers
TOP_INDEPENDENT

Top

Cover image for PAVOI | Social Media Content
Cover image for Sugar Skull | Brand Identity Design
Cover image for KEISH | Social Media Content
$1.5K+ earned
Cover image for Dolce | Brand Identity Design
Profile avatar
Tayyab Ali
PROPakistan
$25k+
Earned
9x
Hired
5.0
Rating
10
Followers
Cover image for Sales Data Analysis & Data Visualization in Power BI
Cover image for Flights Data Visualization in Power BI Integrated with SQL
Cover image for Graph & Vector Database Architectire Development
Cover image for AI Voice Call Agents
Analytics(2)
Profile avatar
Erin Riggers
PROHouston, USA
$5k+
Earned
1x
Hired
5.0
Rating
2
Followers
Cover image for OneTrust Consulting
Cover image for Google Analytics Looker Studio Dashboards
Cover image for Transforming Marketing Insights with GA4
Cover image for TIBCO Analytics Form Looker Studio Dashboards

People also hire

Explore Predictive Analytics projects by Data Visualizers on Contra

Cover image for Bank Customer Churn EDA
0
32
Cover image for Online Grocery Big Data Trends
0
20
Cover image for Diabetes Predictive Model
0
11
Cover image for Ranger Rank
0
13
Cover image for Identity and data visualization for an exhibition
1
34
Cover image for Zoom in/ Zoom out animation chart in Rive
2
360
Cover image for App Developed for World Data | Data Analysis and Visualization
0
178
Cover image for ELECTRONIC SALES PERFORMANCE DASHBOARD
0
4
Cover image for CUSTOMER GAIN PREDICTION DASHBOARD
0
7
Cover image for Unlocking the Formula for Successful Videos on YouTube
0
13
Cover image for Dashboard for climate data
0
34
Cover image for Corporate Dashboard
0
12
Cover image for Flights Data Visualization in Power BI Integrated with SQL
1
61
Cover image for BI Dashboard | Google Analytics | Google Data Studio
1
59
Cover image for Wendy's - Power BI Mobile App
0
95
Cover image for Transforming Complex Census Data into Actionable Insights
1
34
Cover image for Custom Invoicing Solution with Microsoft Paginated Reports
0
35
Cover image for Reddington Family Care
0
57
Cover image for Anike Bridge Profit Analysis
1
112
Cover image for ASK4 | Infographics and Data Visualisation
0
32
Cover image for Airlines Flights Data Visualization in Power BI Integrated with
3
51
Cover image for Sales Data Analysis & Data Visualization in Power BI
2
103
Cover image for KPI Tracking in Plecto | Live TV Dashboards
1
102
Cover image for People Activity Data Visualization Elasticsearch Kibana
1
73
Cover image for 💓 Heart Data | 3D Rendering and Data Visualization💓
0
5
Cover image for ETL + OpenCV + Scikit-learn (AI COVID-19 Data Analysis)
2
30
Cover image for Sales Report Dashboard on Power BI
2
93
Cover image for [Case Studies] How I helped startups with product growth
0
17
Cover image for Transforming Marketing Insights with GA4
0
10
Cover image for Google Analytics Looker Studio Dashboards
0
20
Cover image for HP DevOne Product Launch Marketing Spend Looker Dashboards
0
10
Cover image for Optum Annual Clinician Forum Looker Studio Reports
0
3
Cover image for TIBCO Analytics Form Looker Studio Dashboards
0
4
Cover image for DELL Virtual Dev Conference Analytics Looker Studio Dashboard
0
2
Cover image for Get Licensed | Revenue Forecasting Algorithm
0
3
Cover image for Daman Markets Prediction App
2
33
Cover image for Analytics at CRED
0
13
Cover image for Analytics at SHEROES
1
5
Cover image for Complaion – Streamlining ISO Certification
3
139
Cover image for Ivorypay - Crypto payment gateway
1
2
Cover image for Power BI Inventory Control Dashboard for Efficient Stock Managem
0
59
Cover image for Custom Power BI Sales Analytics Dashboard
0
22
Cover image for Real-Time Truck Fleet Monitoring Dashboard
0
17
Cover image for Series of SaaS Analytics Dashboards
0
15
Cover image for BI Specialist for Meta Ads Dashboard Integration
1
28
Cover image for Data Visualisation For Bright Data
1
13
Cover image for How to Tell Stories with Data
0
6

Top services from Data Visualizers on Contra

Top locations for Data Visualizers for Predictive Analytics

Data Visualizers for Predictive Analytics near you

Cover image for Houseplant Database
0
5
Cover image for California Overdose Prevention Network (COPN)
0
1
Cover image for Weather Broadcasting Bot
0
4
Cover image for Interactive Map / Project Status Report on Power BI
0
8
Cover image for Series of SaaS Analytics Dashboards
0
15

Join 50k+ companies and 1M+ independents

Contra Logo

© 2025 Contra.Work Inc