Nuclear And Carbon
Arnaldo Matute
Nuclear Energy and Carbon Intensity
A short excercise of linear regression and data visualization. This dataset has been acquired from https://www.kaggle.com/datasets/pralabhpoudel/world-energy-consumption
Possible correlation
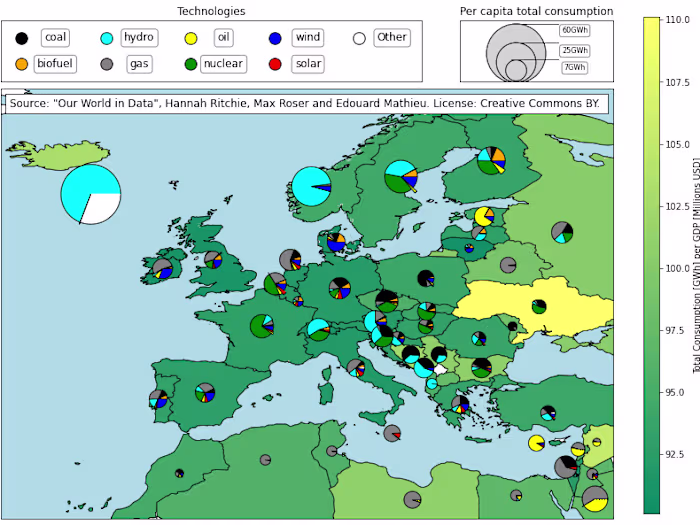
The more Nuclear energy a country produces, the more contamination there is? Or maybe it is not true. This study comprises all years in the 21st century and tests whether there is some correlation between nuclear energy share and the carbon intensity in the countries that apply.
In the end, an animated GIF shows all linear regressions made for these two variables. To provide more information, the radii of the markers in the scatterplot are proportional to the total energy consumption of the respective country.
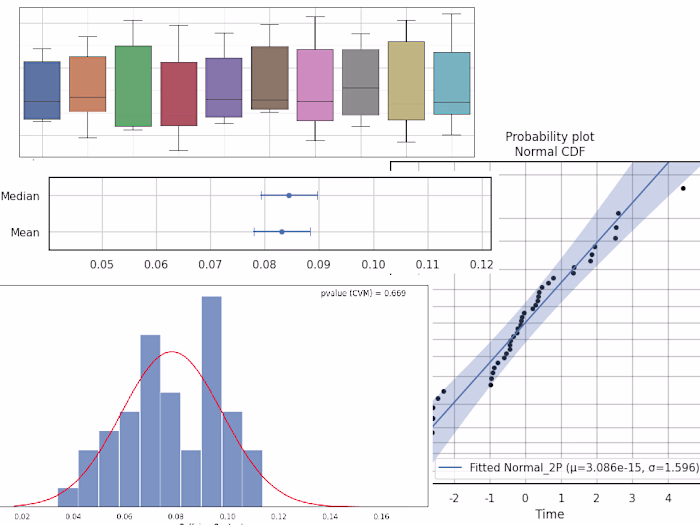
For all years in the 21st century, the linear regression shows a NEGATIVE slope. The more nuclear energy there is in the energy matrix of the country, the less its carbon intensity. As usual, we must remember that correlation does not imply causation. Nevertheless, this can be an argument to convince people that doubt how clean nuclear energy is.
In the end, p-values for every year's regression are printed.
Like this project
Posted Jul 21, 2023
Short analysis about nuclear energy and its real effects on environment - GitHub - ArnaldoMatute/NuclearAndCarbon: Short analysis about nuclear energy and its …
Likes
1
Views
40