Energetic Overview EMENA Region
Arnaldo Matute
EnergeticOverviewEMENA
A Data Visualization Project about energy technologies and efficiency in Europe, the Middle East, and North Africa
Metrics to consider
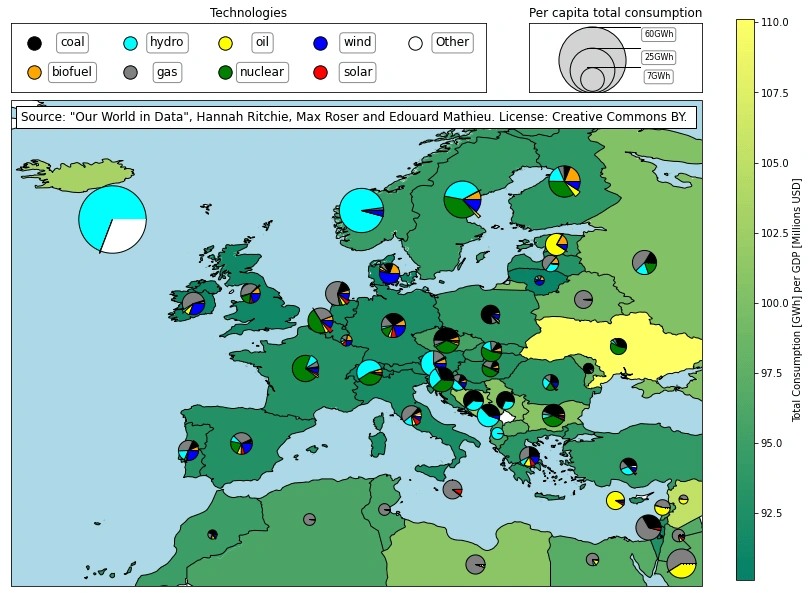
The generated images will contain pie charts for each country in the EMENA region geographically positioned on Cartopy maps. Their radii will be proportional to the per capita electricity consumption for each country. Moreover, the ratio of electricity consumption per GDP will be mapped through the color of the country on the map. So this image will offer an immediate overview of:
Share of each technology used to produce electricity in each country through the pie chart.
Through the piechart size, per capita electricity consumption.
Electricity consumption per unit of GDP (Millions of 2015 US dollars) through the color of the country on the map.
See it in detail on GitHub: https://github.com/ArnaldoMatute/EnergeticOverviewEMENA
Energetic Overview - EMENA Region
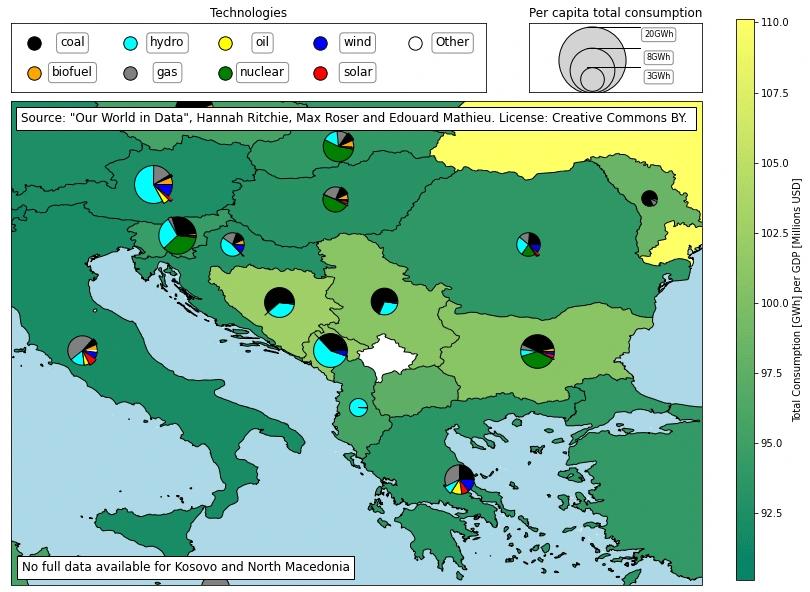
Zoom in to the Balkans
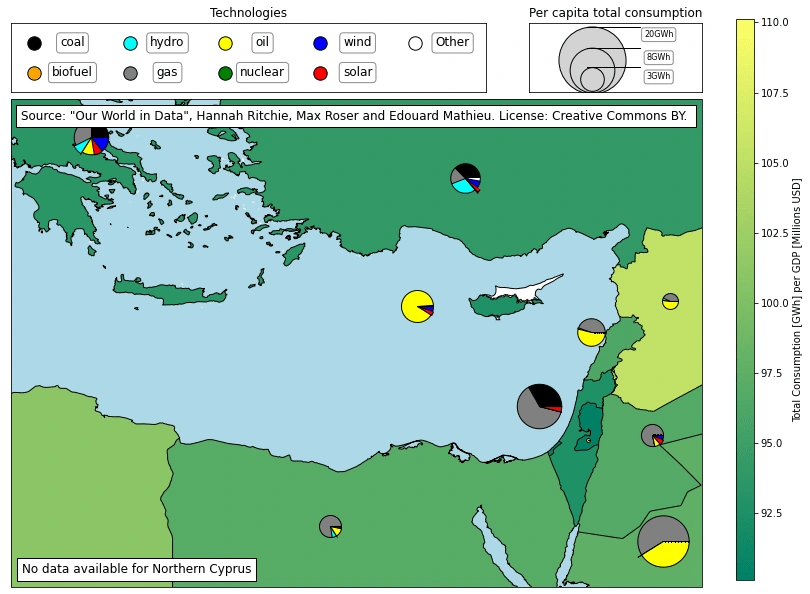
Zoom in to the Middle East
Like this project
Posted Jul 21, 2023
A Data visualization Project about energy technologies and efficiency in Europe, Middle East and North Africa
Likes
3
Views
69