ELECTRONIC SALES PERFORMANCE DASHBOARD
Laksmi Wulandiari
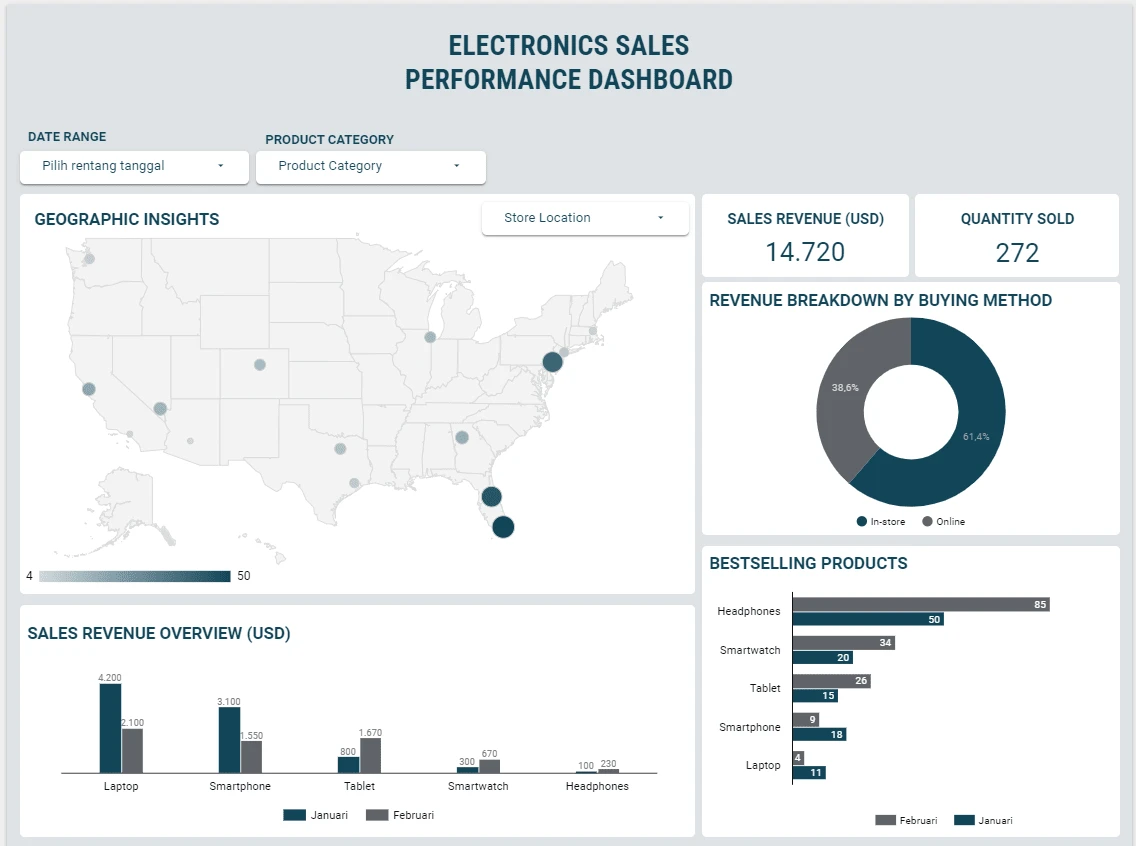
📊 Excited to showcase my latest data visualization project! 🚀 Dive into the world of sales analytics with this interactive dashboard using #Lookerstudio , offering insights into performance across product categories and store locations. 🛒💼
🔍 Explore trends in sales revenue per category for each month, discover the top-selling product categories, and analyze the revenue breakdown by buying method (in-store vs. online). 📈💡
💼 Whether you're a sales manager tracking performance or a data enthusiast looking for insights, this dashboard provides valuable information to drive informed decisions. 💬💼
🔗 Check out the live dashboard here, and let's connect to discuss how data visualization can empower your business! 🌟📊
#DataVisualization #Dashboard #SalesAnalytics #DataInsights #BusinessIntelligence #DataDrivenDecisions #LookerStudio
Like this project
Posted Feb 15, 2024
Electronic sales performance dashboard using Looker Studio
Likes
0
Views
22