


What are the key qualities to look for in a data visualizer?
When hiring a data visualizer, look for creativity and attention to detail. They should have strong technical skills to handle data visualization tools. Understanding of the subject area you're working on is also important. Make sure they can explain complex data in simple ways. Communication skills are key to ensuring your ideas and goals align.
How do I define the project's goals for a data visualizer?
Start by explaining what you want to achieve with the project. Be clear about the message you want your data visualization to convey. Specify any important data points you want highlighted. Discuss the timeline you have in mind. This helps the data visualizer understand your vision.
What should I include in the project brief for a data visualizer?
A project brief needs clear objectives and expected outcomes. Include details about your audience and how they will use the data visualization. Provide any relevant data sets the visualizer will work with. Mention any preferred styles or examples for inspiration. This gives the data visualizer a good starting point.
How do I evaluate a data visualizer's portfolio?
Look for examples of work similar to your project needs. Assess the clarity and creativity in their previous visualizations. Check how they handle different types of data and complexity. Make sure their style matches what you're looking for. A strong portfolio indicates good skillset and experience.
Why is it important to discuss data source reliability with the data visualizer?
Reliable data is the foundation of good data visualization. Discussing data sources ensures both parties understand the data's origin. This helps in maintaining integrity and accuracy. The data visualizer might also suggest alternative sources. Clear communication prevents misunderstandings later in the project.
How can I use feedback to ensure a successful data visualization project?
Provide clear and constructive feedback at every stage of the project. Regular check-ins help keep the project on track. Encourage the data visualizer to share progress and ask questions. Be open to suggestions and adaptability. This collaborative approach results in a better final product.
What deadlines should I set with a data visualizer?
Set realistic and clear deadlines for each project phase. Factor in time for reviews and revisions. Discuss the final delivery date upfront to manage expectations. Ensure there's enough time for necessary adjustments. This aids in smooth project completion and reduces last-minute stress.
How do I ensure clear communication with a data visualizer?
Establish preferred communication channels before the project starts. Set regular updates to discuss ongoing progress. Make sure both parties are clear on points being discussed. Encourage questions for clarity. Effective communication keeps everyone on the same page.
What role does creativity play in data visualization?
Creativity makes data visualizations engaging and understandable. It helps convey complex data in simple ways. Discuss creative elements like colors, styles, and layouts. Allow the visualizer to explore innovative methods. A creative approach can highlight key information effectively.
How do project revisions impact the timeline?
Revisions ensure the final output meets expectations. Discuss potential revision timeframes beforehand. Realistic timelines account for expected revisions. This keeps both the visualizer and client prepared. Clear timelines help minimize delays and deliver quality work on time.
Who is Contra for?
Contra is designed for both freelancers (referred to as "independents") and clients. Freelancers can showcase their work, connect with clients, and manage projects commission-free. Clients can discover and hire top freelance talent for their projects.
What is the vision of Contra?
Contra aims to revolutionize the world of work by providing an all-in-one platform that empowers freelancers and clients to connect and collaborate seamlessly, eliminating traditional barriers and commission fees.
People also hire


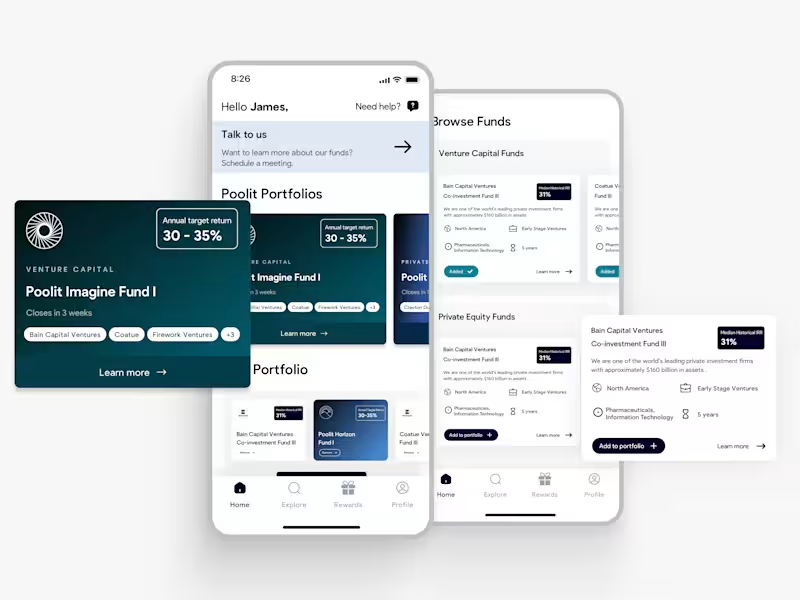
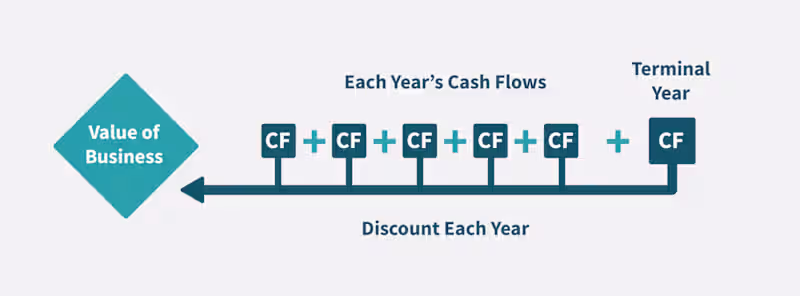
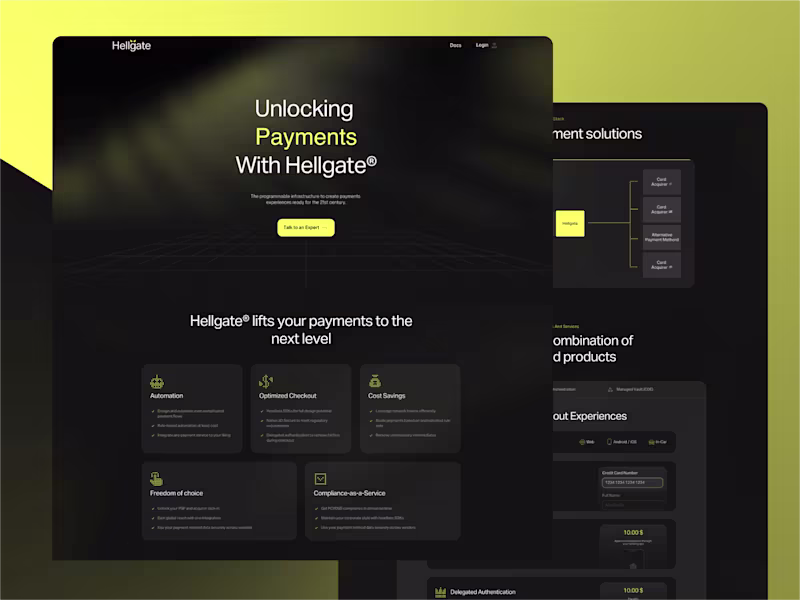
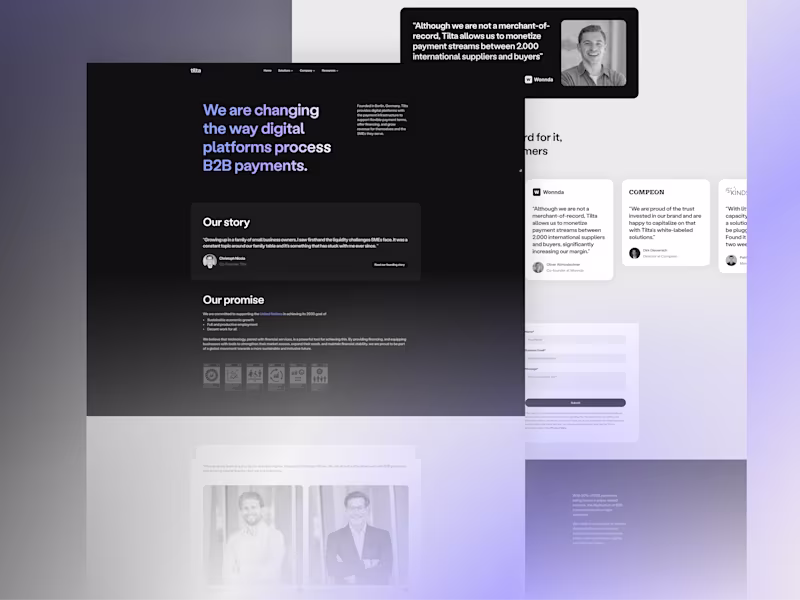
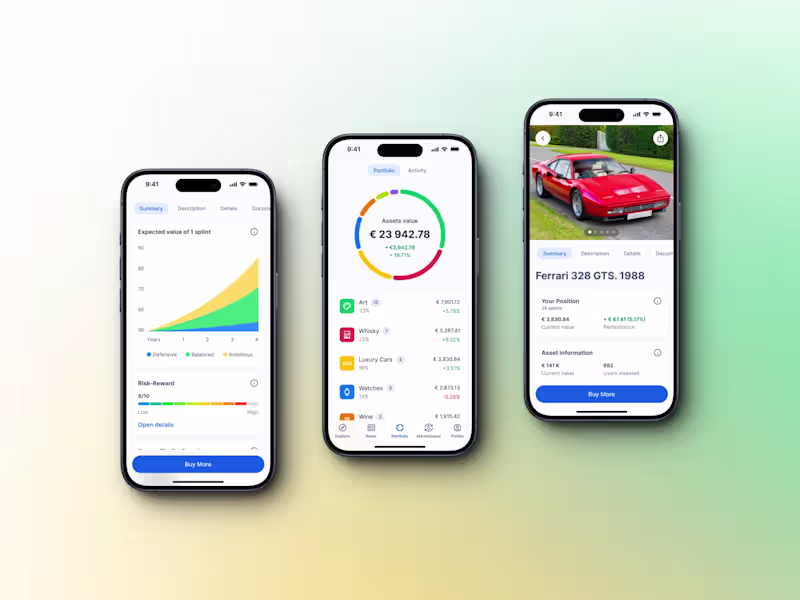
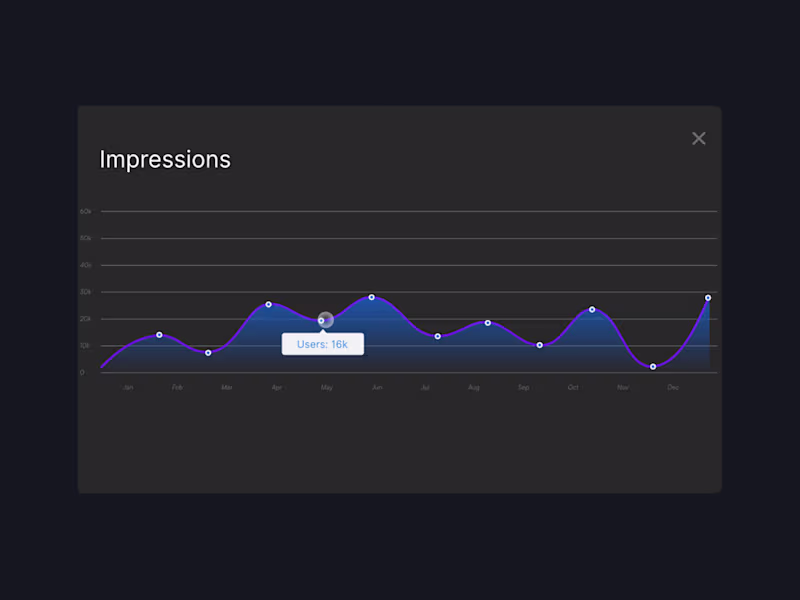
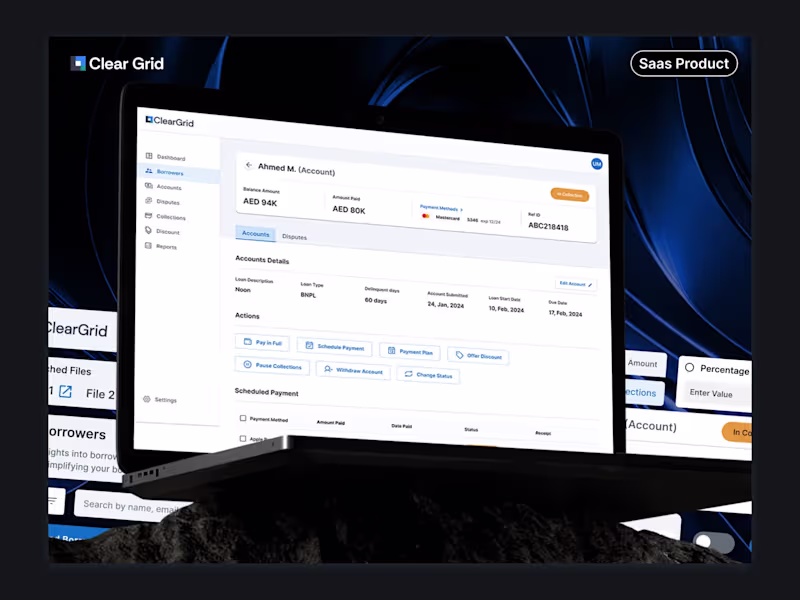
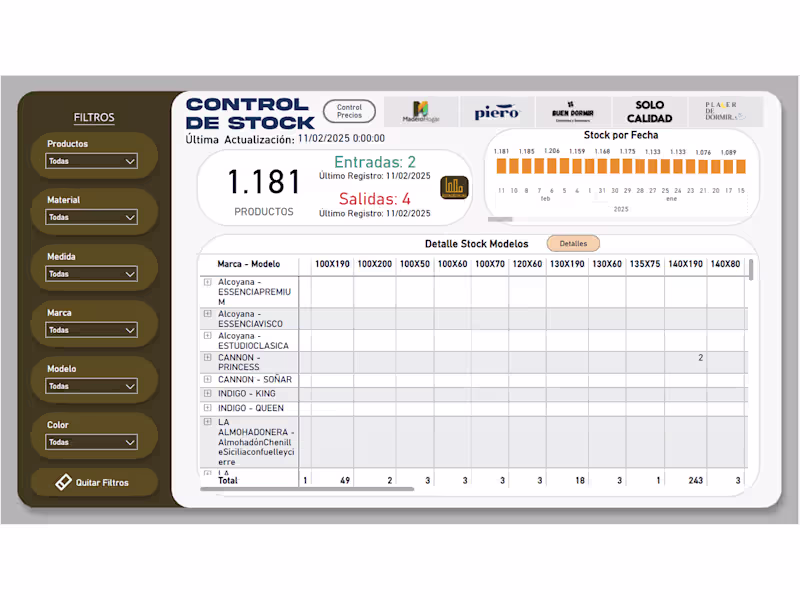
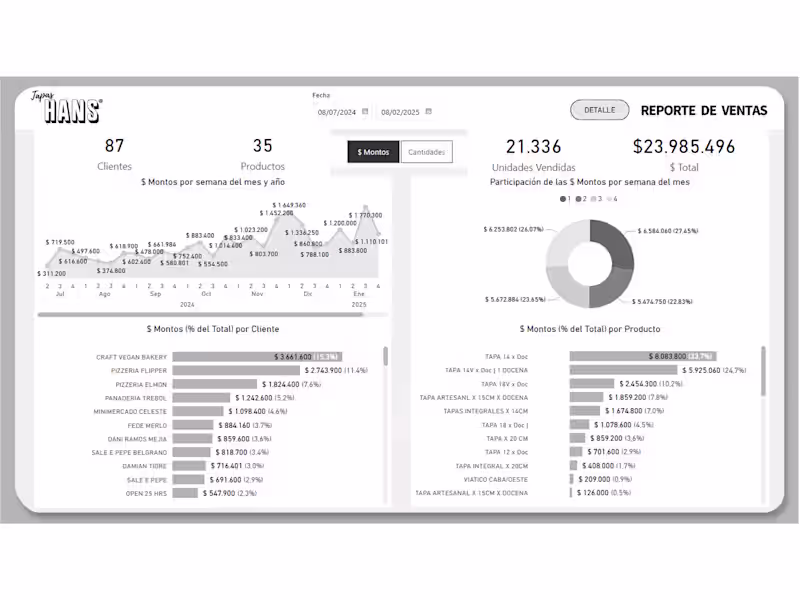
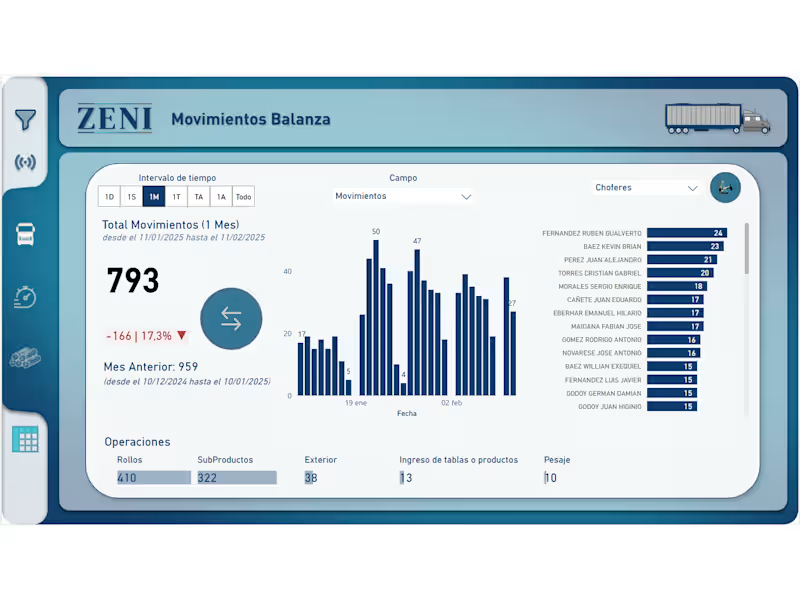
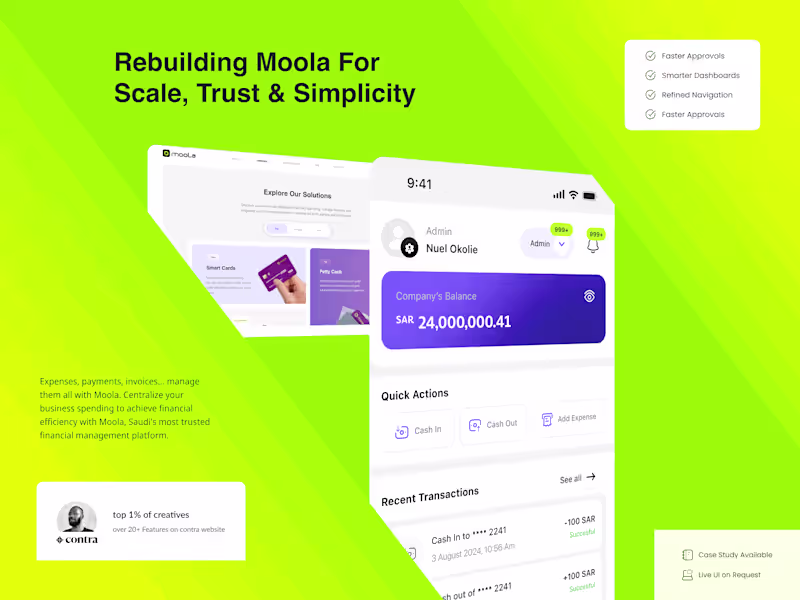
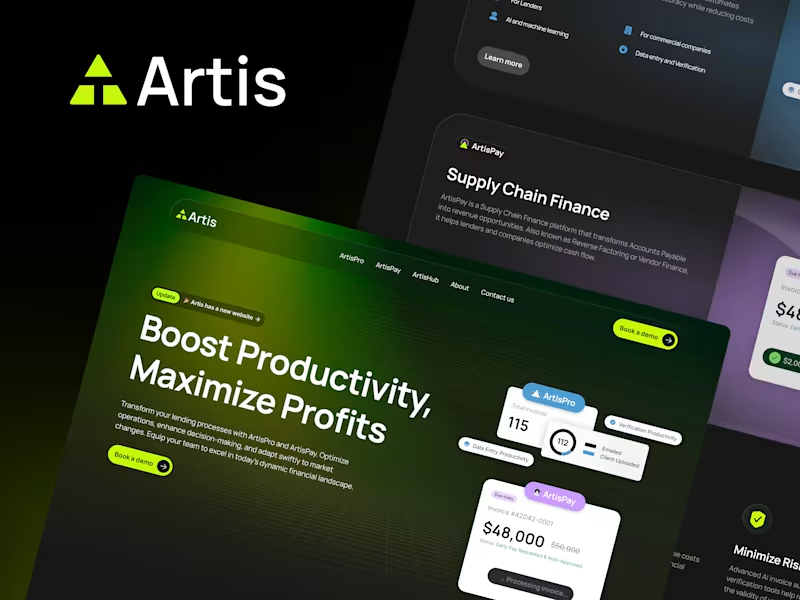
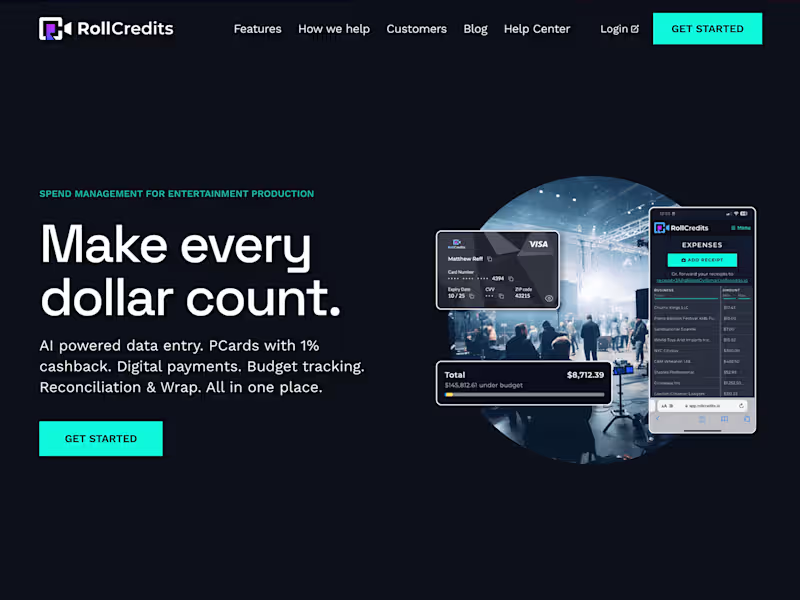
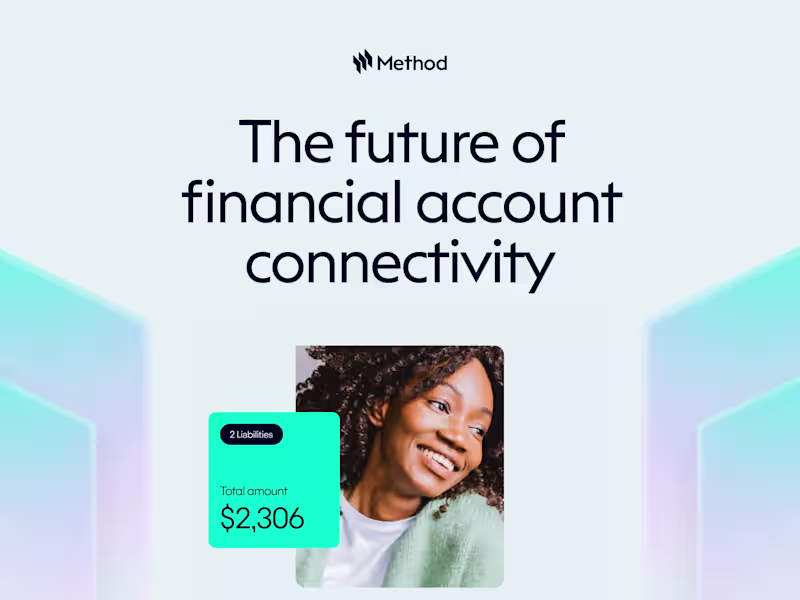
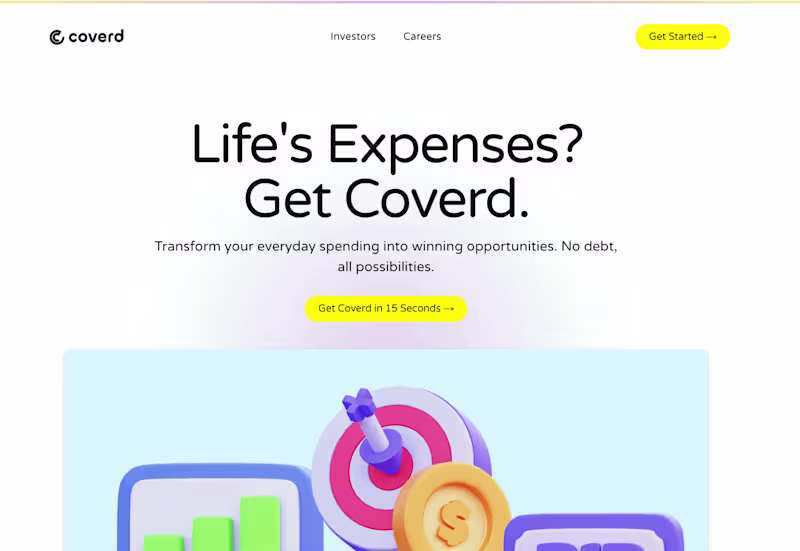
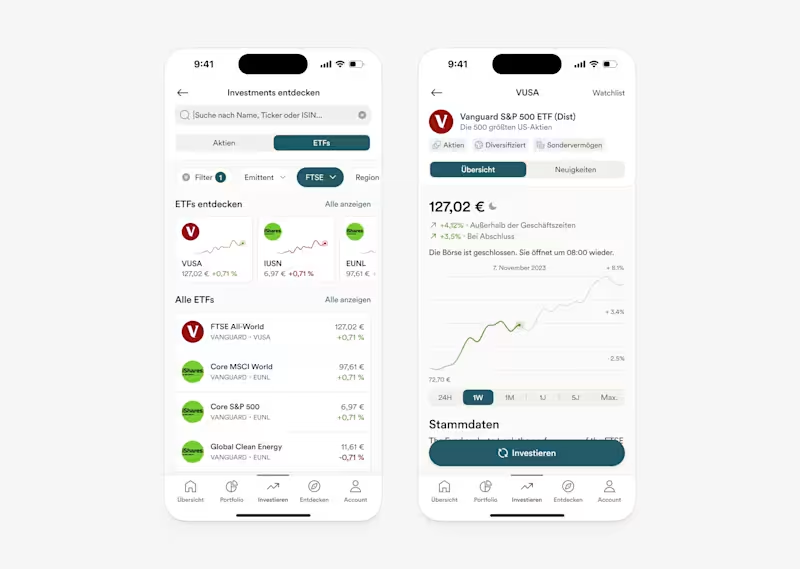
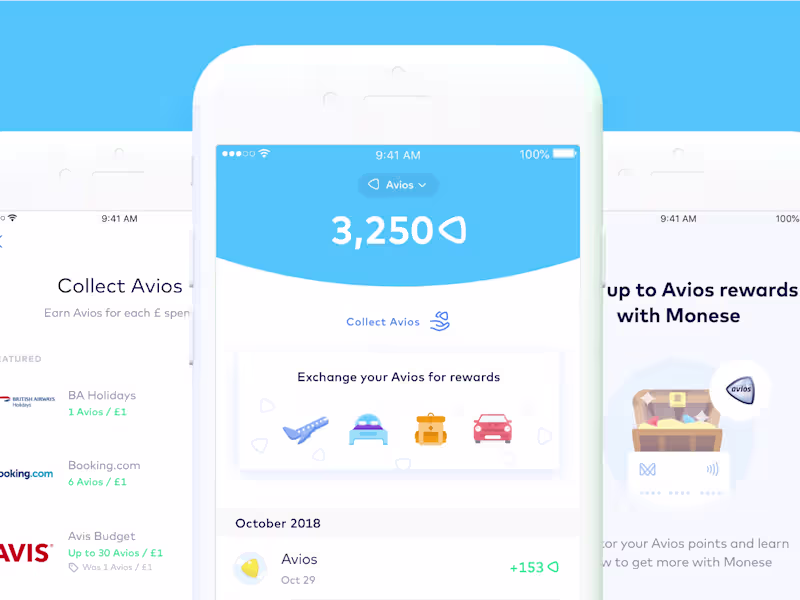
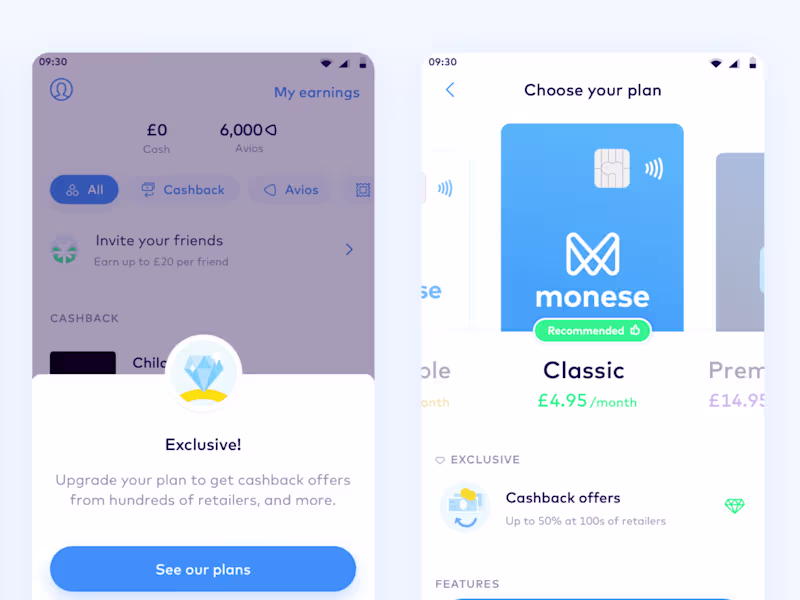
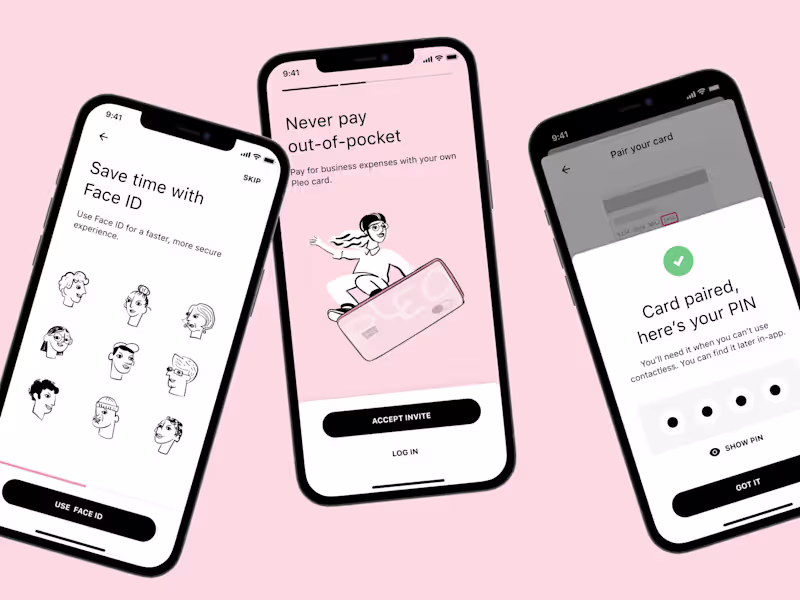
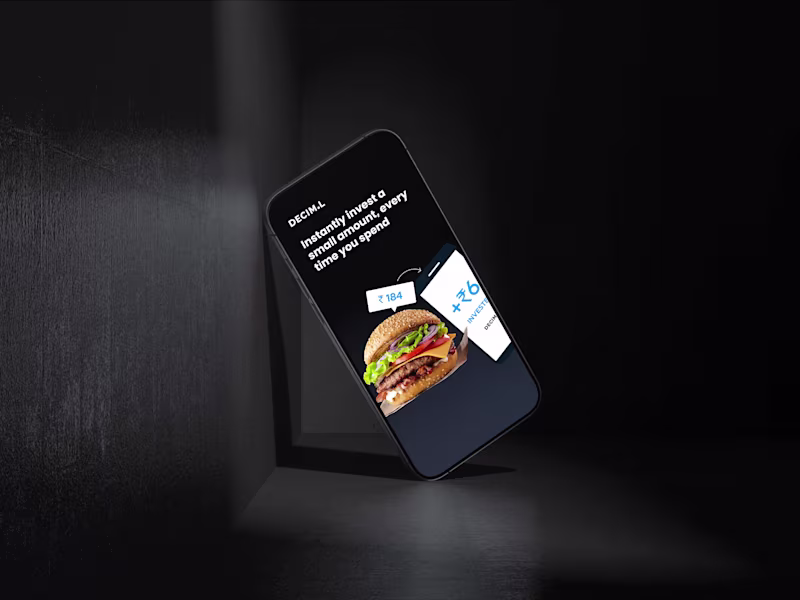
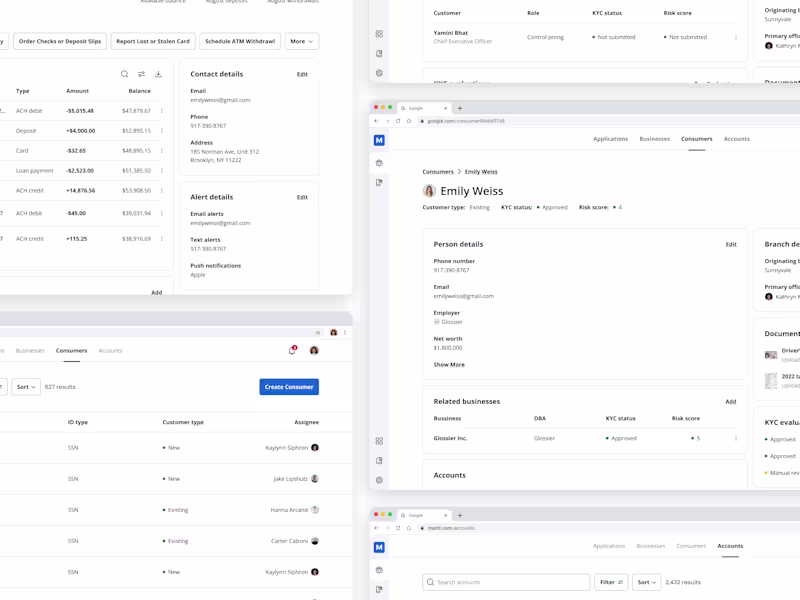
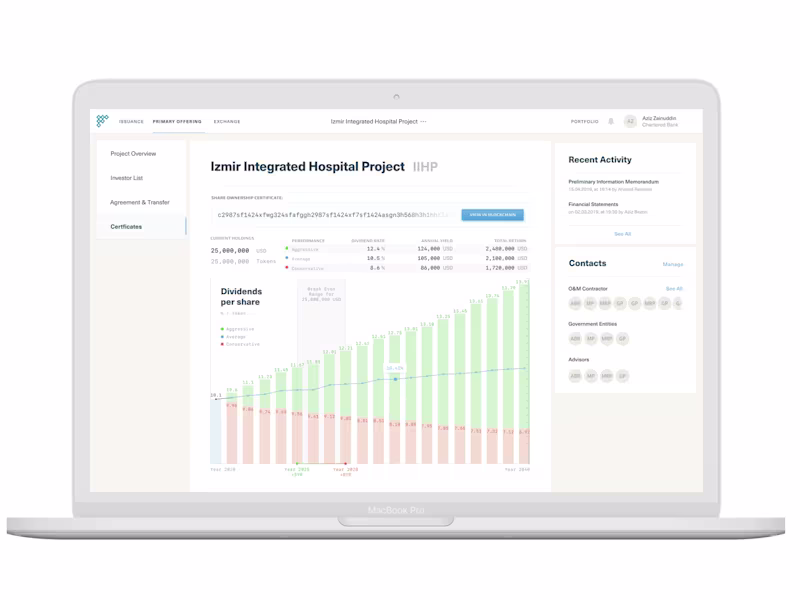
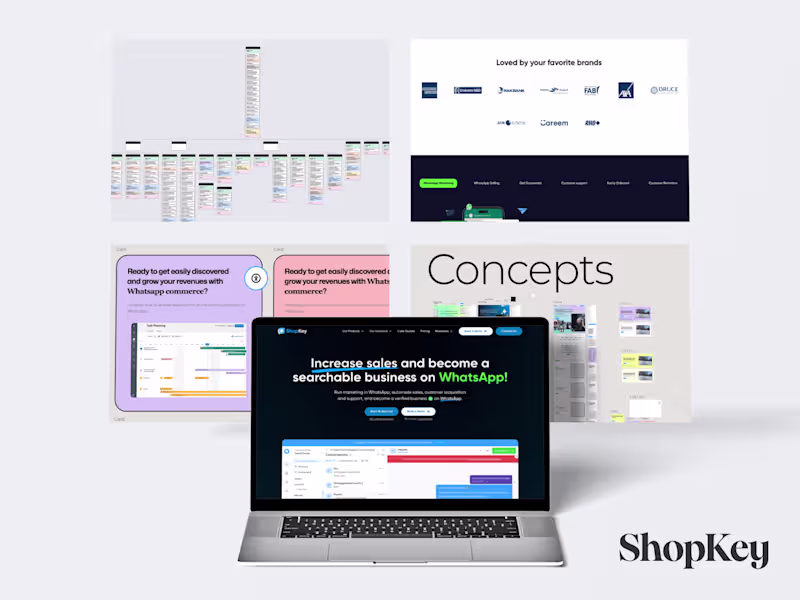
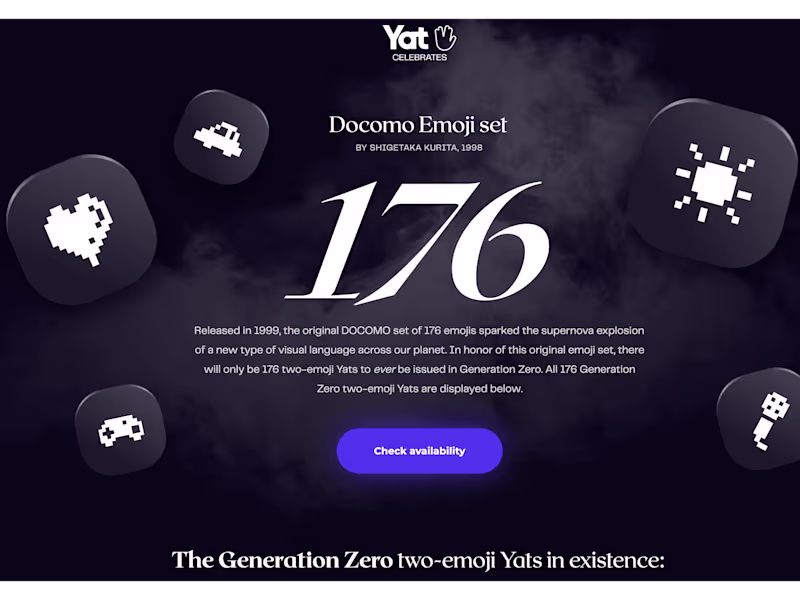
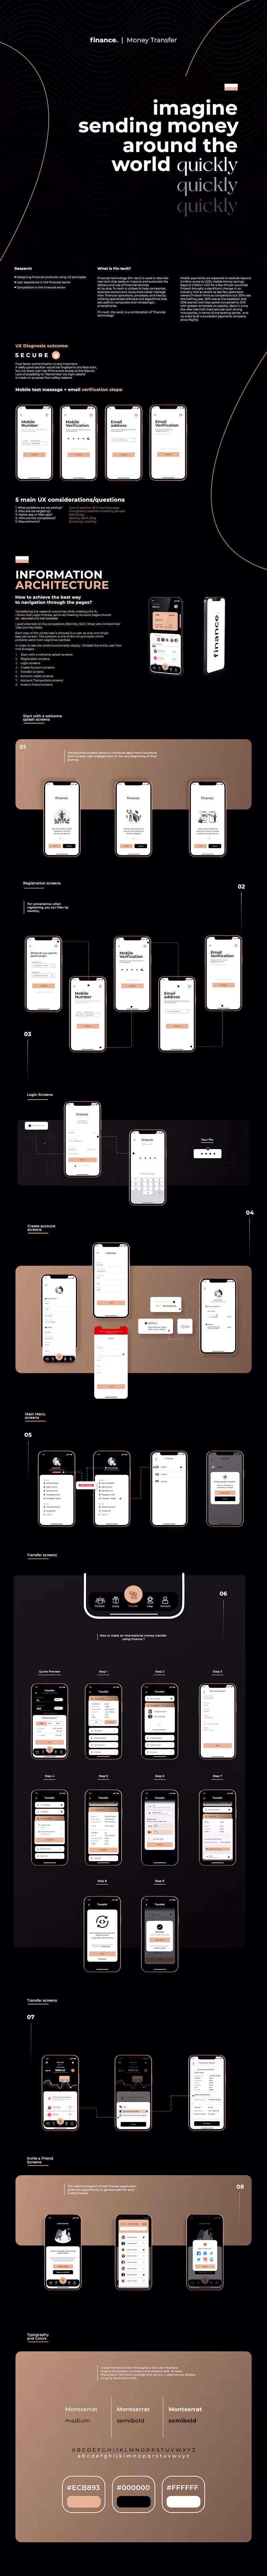
Explore FinTech projects by Data Visualizers on Contra


Top services from Data Visualizers on Contra

Microsoft Excel
Data Scientist
Data Analyst
+3
Transform Your Financial Data Into Simple And Actionable Insight
$500
Microsoft Excel
Data Visualizer
Data Analyst
+4
Smart Financials: Automated Monthly Income Statement Reporting
$1,000
Microsoft Excel
Data Analyst
Accountant
+4
Smart Financials: Automated Monthly Cash Flow Report
$2,000