Helping B2B businesses unlock growth with AI & Automations
- $5k+
- Earned
- 5x
- Hired
- 5.0
- Rating
- 15
- Followers
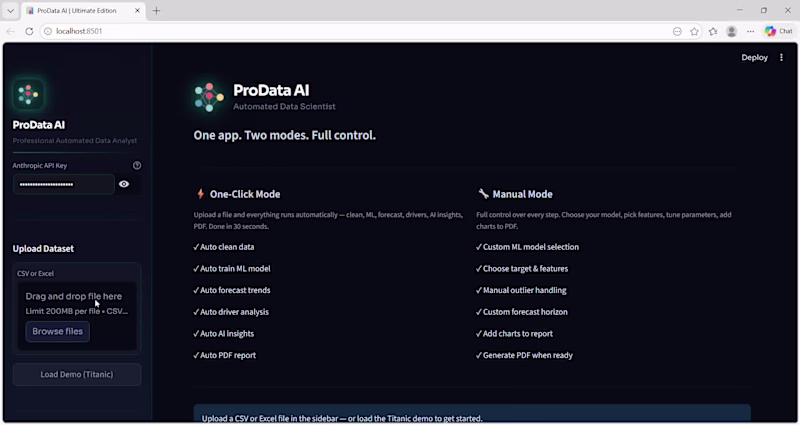
Helping B2B businesses unlock growth with AI & Automations
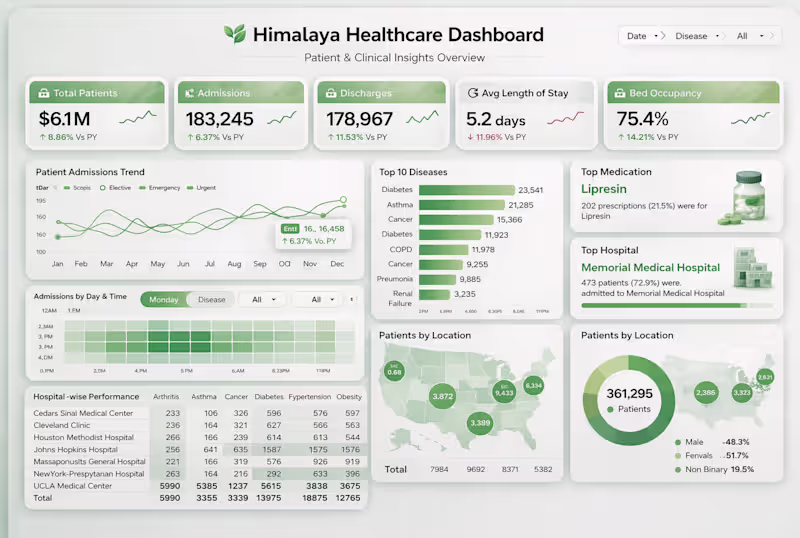
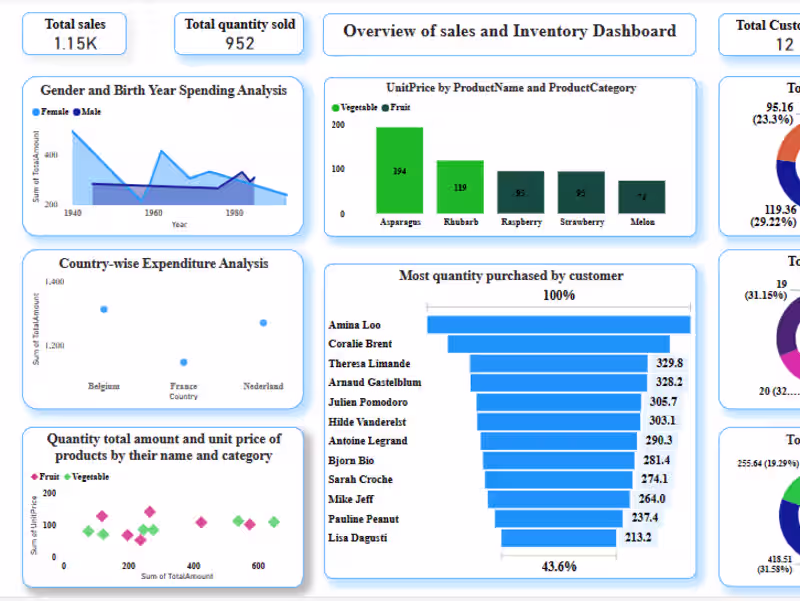
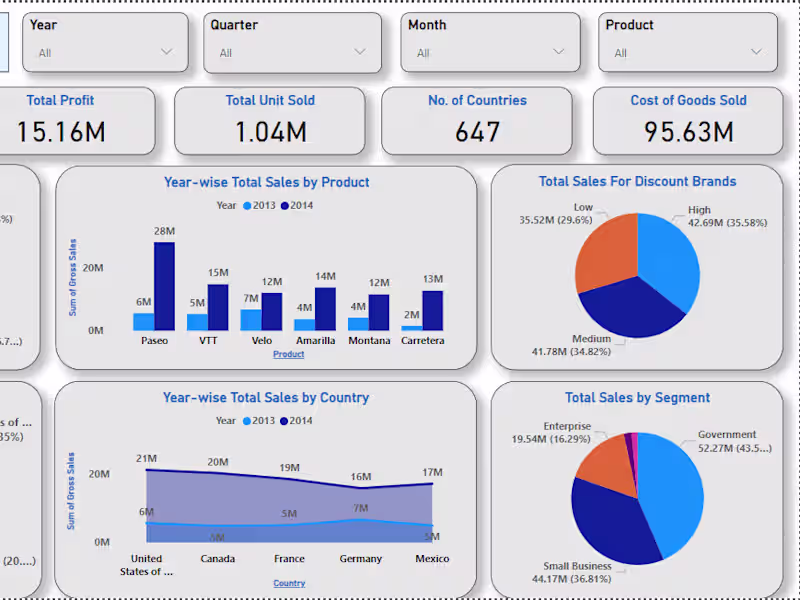
AI Data Analyst | Power BI & Python | Automated Reports
Aspiring Data Analyst | Exploring Visualization projects
Aspiring Data Analyst | Exploring Visualization projects

View more →
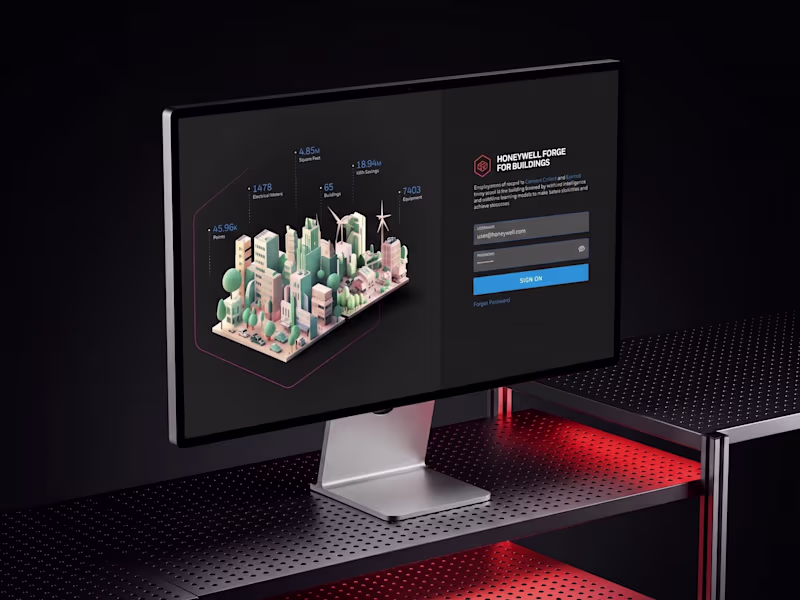
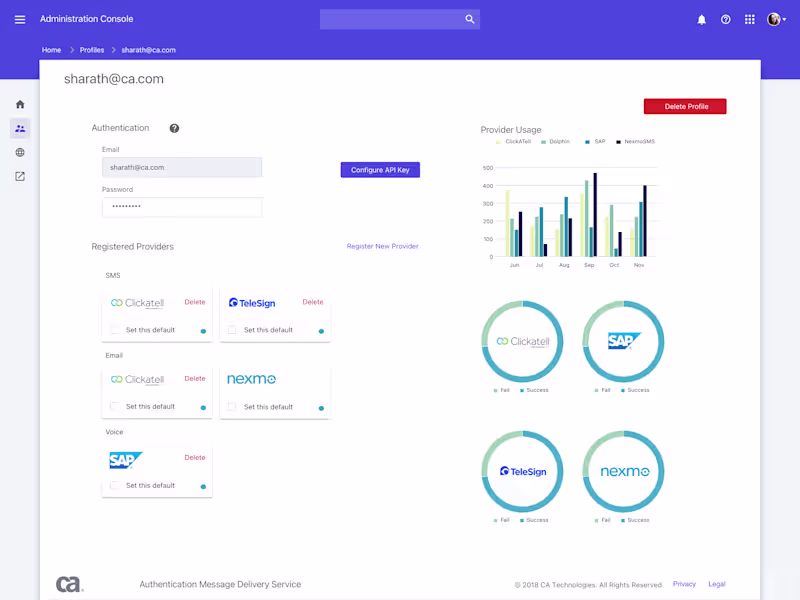
Engineer turned UX Designer for SaaS / Enterprise companies
Engineer turned UX Designer for SaaS / Enterprise companies

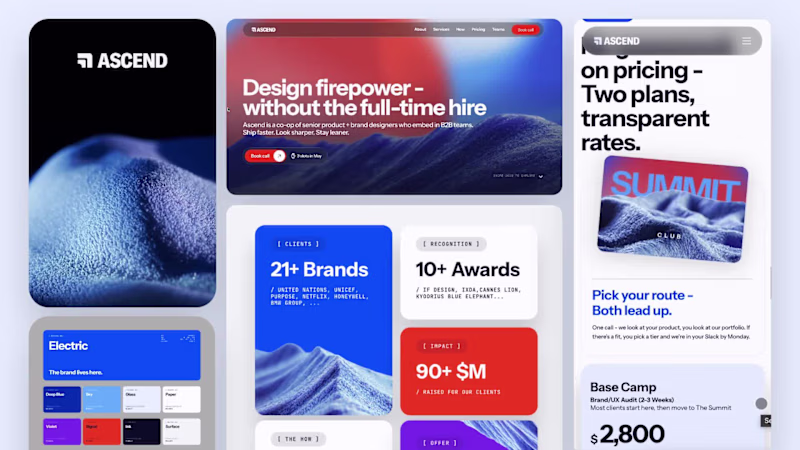
Elevate Your Success Where Efficiency Meet ME
Elevate Your Success Where Efficiency Meet ME
View more →
Versatile Project Manager & Data Wizard 🌟
Versatile Project Manager & Data Wizard 🌟


View more →
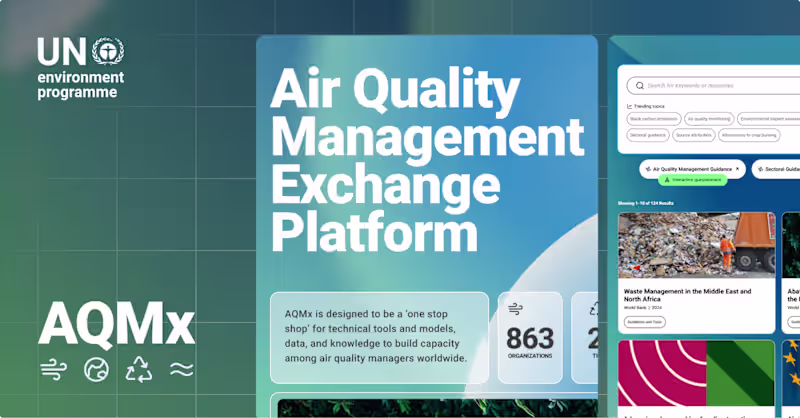
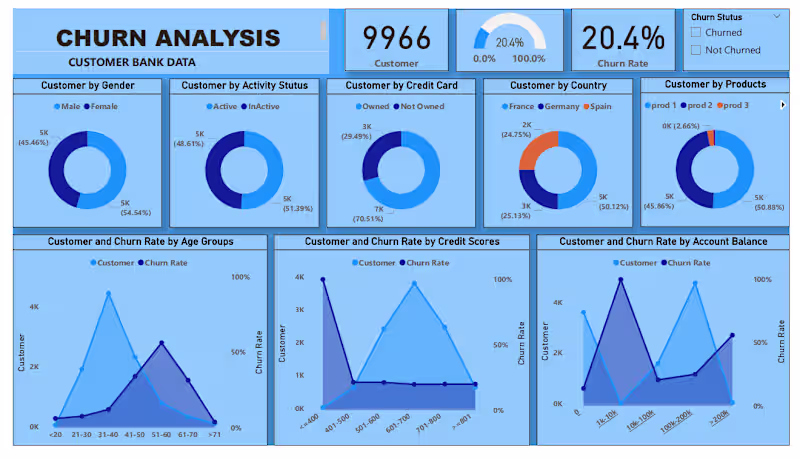
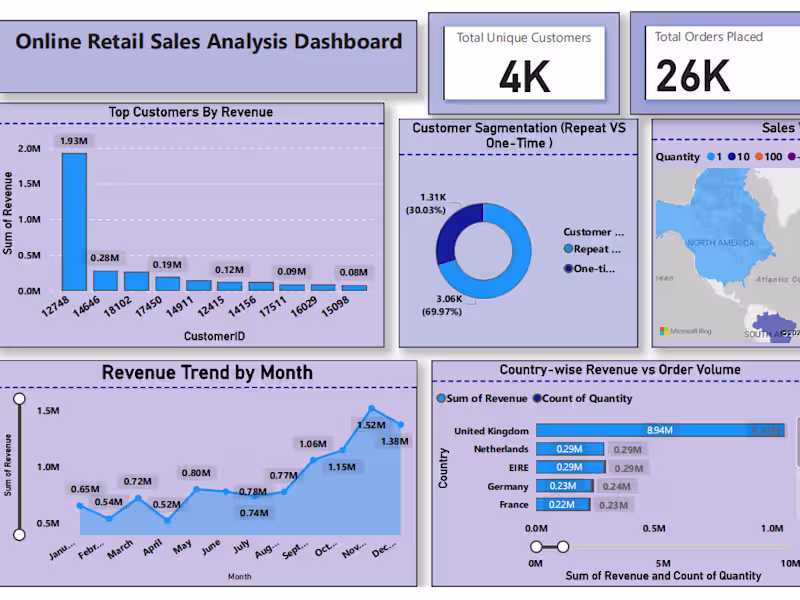
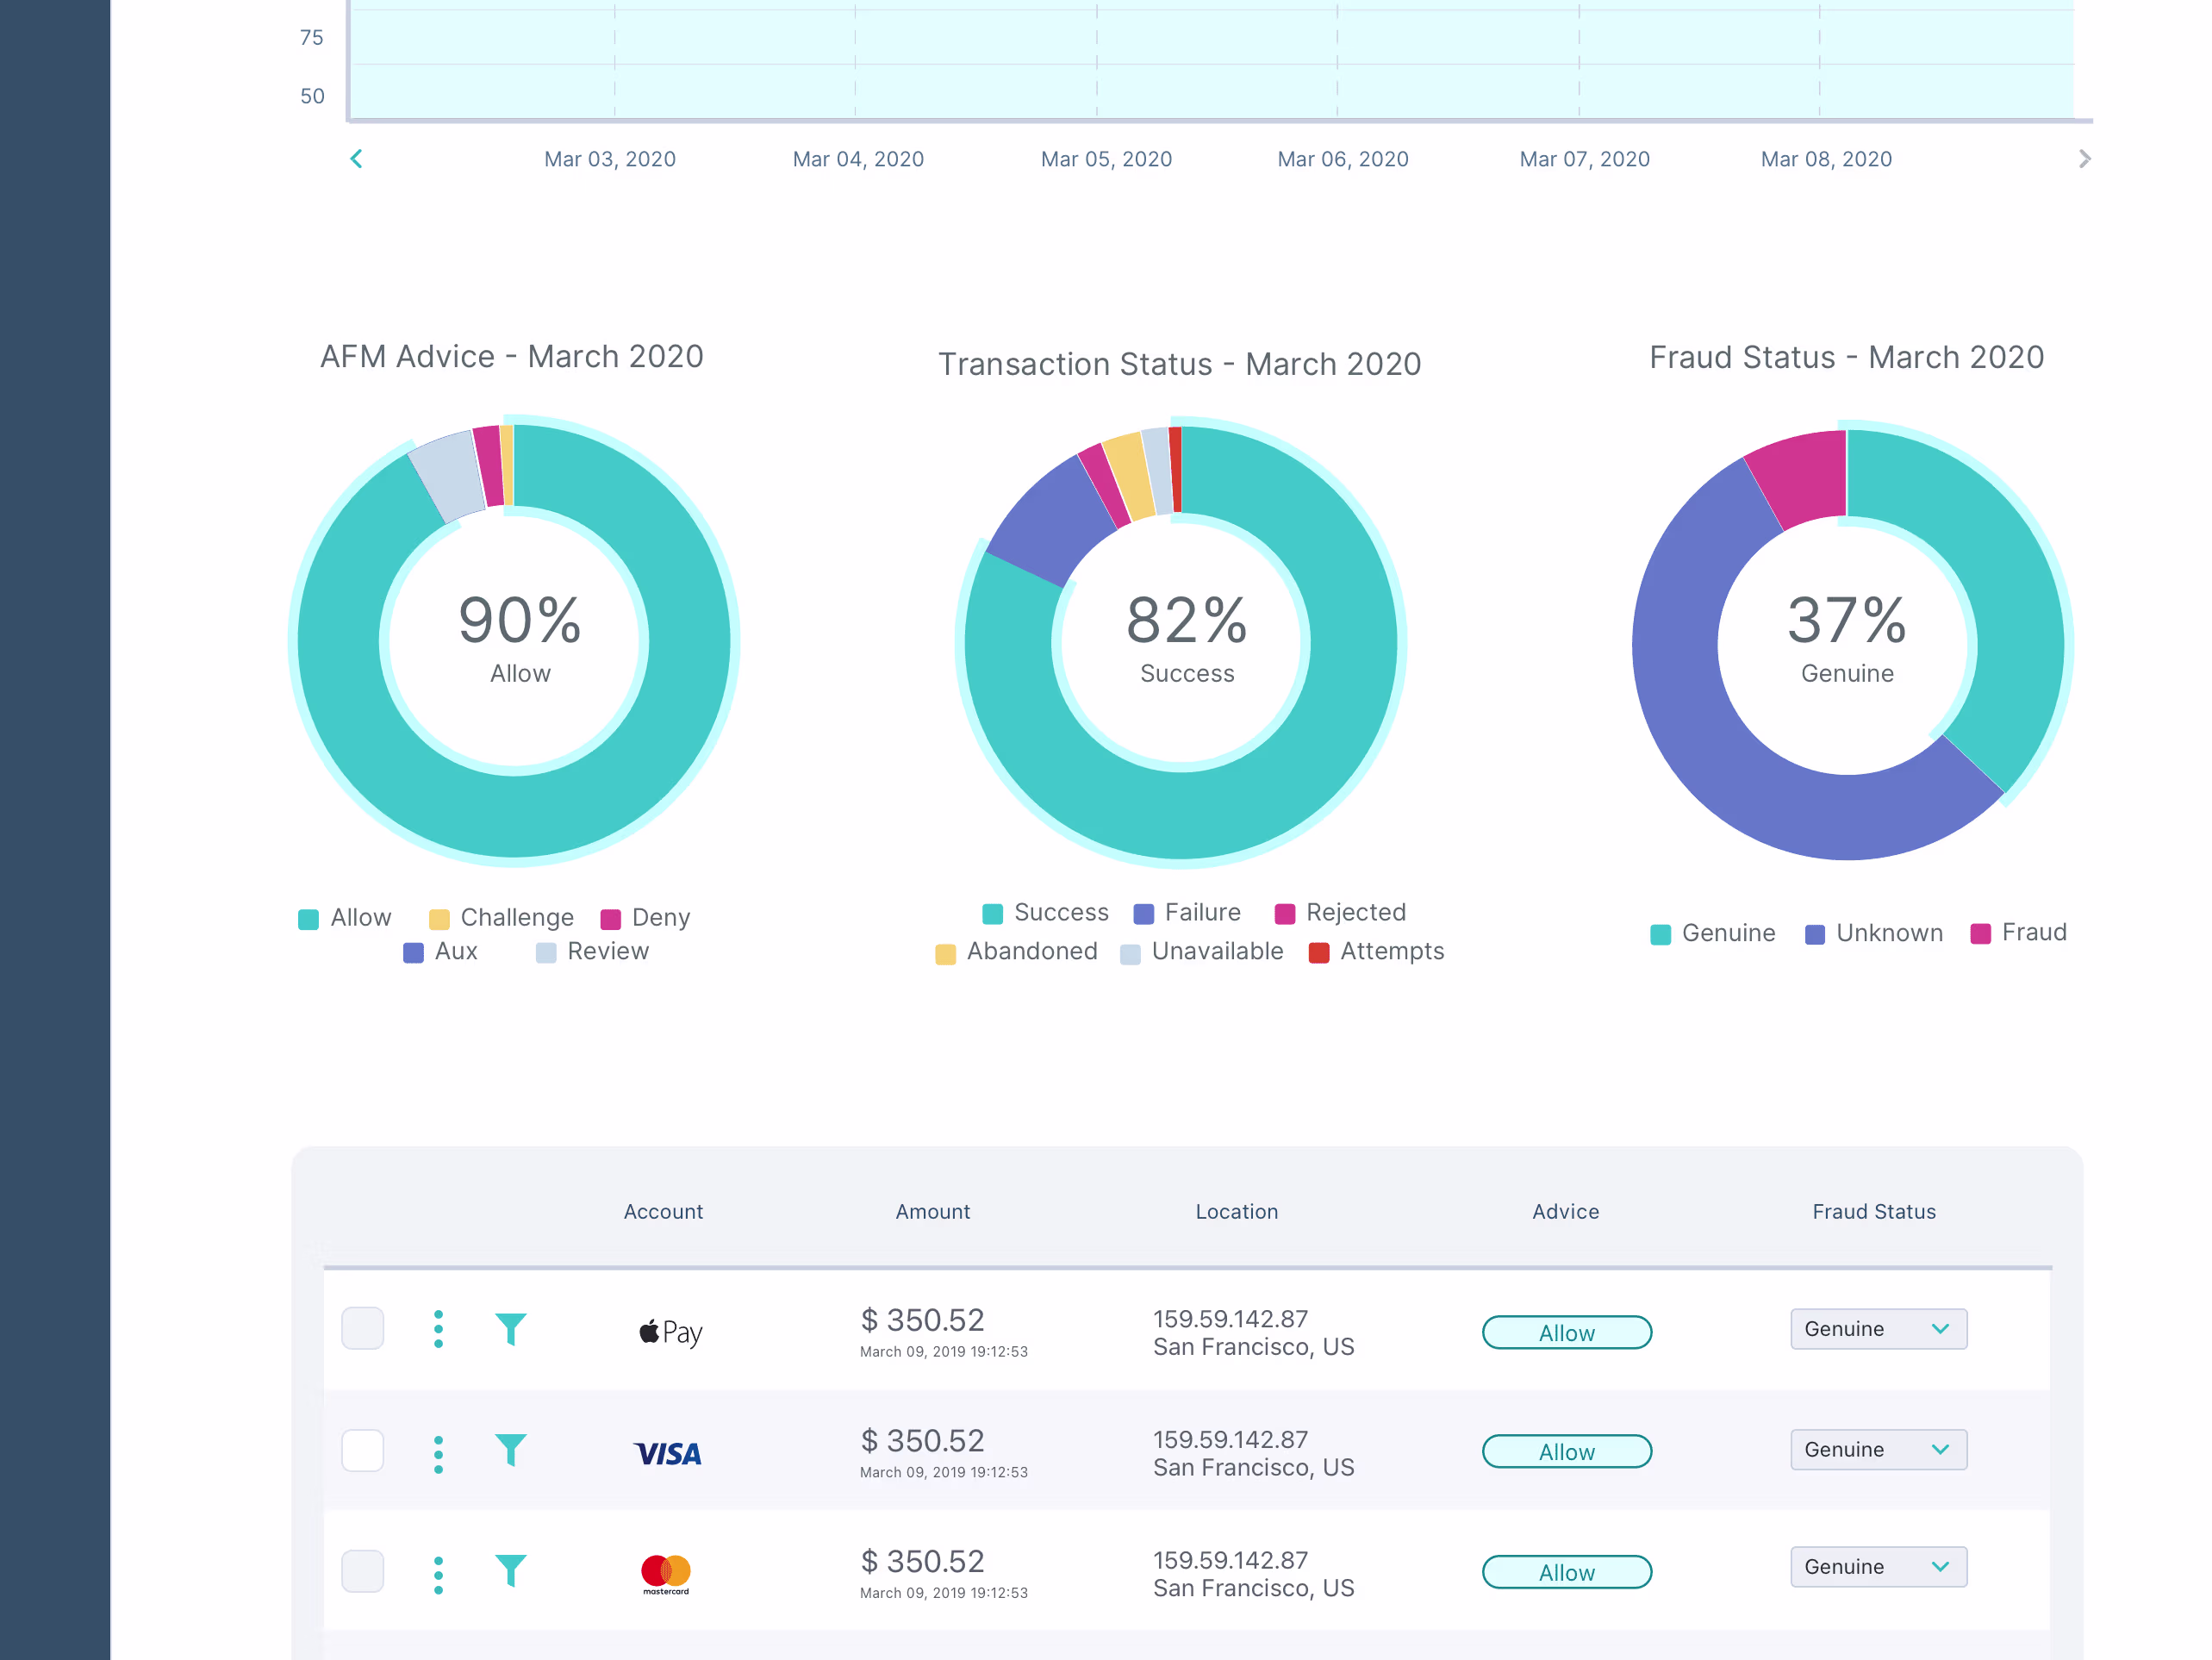
Dynamic Data Analysis & Visualization Expert
Dynamic Data Analysis & Visualization Expert

View more →
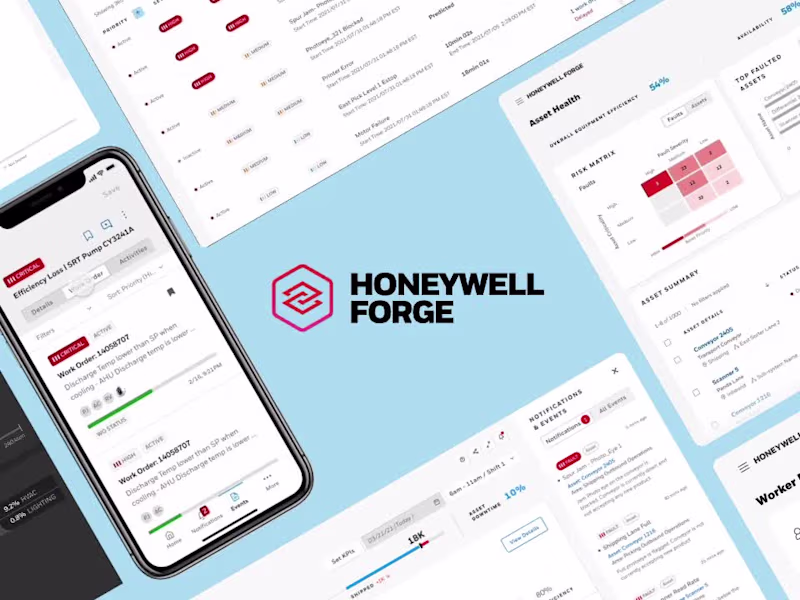
Senior UX Designer | Enterprise SaaS & AI-Native Products