Personal Finance Tracker with Anomaly Detection
Kavyashree Sanjakadavu
💰 Personal-Finance-Tracker-with-Anomaly-Detection
A Python-based finance tracker using Pandas and anomaly detection techniques to identify irregular expenses and improve financial planning.
Live Demo: Click here to try the app
Overview
The Personal Finance Tracker with Anomaly Detection is a Python-based application designed to help users take control of their personal finances.
It enables users to track their income, expenses, and savings, while providing actionable insights through interactive visualizations.
The project extends beyond basic finance tracking by implementing anomaly detection techniques, including statistical methods such as Z-scores and machine learning methods like Isolation Forest, to identify unusual transactions or spending patterns.
The app uses a synthetic dataset generated with Python's Faker library to simulate realistic financial transactions, ensuring that users can explore the tool even without real data. Visualizations are built using Plotly and Seaborn, providing intuitive charts for monthly trends, expense breakdowns by category, and highlighting potential anomalies.
This project is ideal for anyone interested in personal finance management, data analysis, or learning how statistical and machine learning methods can be applied to real-world problems.
Features
Income and expense tracking
Interactive visualizations using Plotly and Seaborn
Anomaly detection to flag unusual transactions
Synthetic dataset generation for testing
Tech Stack
Python
Pandas, NumPy
Scikit-learn
Matplotlib, Seaborn, Plotly
Streamlit
Project Workflow
This project was developed in multiple stages, reflecting a complete end-to-end data analysis and deployment pipeline:
Data Generation:
Using Python's Faker library, a synthetic dataset of financial transactions was generated. The dataset includes multiple categories such as food, rent, travel, shopping, and utilities, simulating realistic income and expense patterns.
Data Cleaning and Preparation:
The raw synthetic data was cleaned and preprocessed to handle missing values, ensure consistent formatting, and prepare it for analysis. The cleaned dataset [personal_finance_clean.csv] serves as the foundation for all visualizations and anomaly detection.
Anomaly Detection Implementation:
Two methods were implemented to detect unusual transactions:
Z-score: A statistical method to identify outliers based on deviation from the mean.
Isolation Forest: A machine learning algorithm capable of detecting anomalous patterns in multi-dimensional transaction data.
Visualization and Insights:
Interactive and static charts were created using Plotly and Seaborn. These visualizations provide monthly trends, category-wise spending breakdowns, and highlight anomalies. Each chart is accompanied by insights to help understand the financial patterns and unusual transactions.
Deployment:
Finally, the project was deployed as a Streamlit app on the Streamlit Community Cloud, allowing users to interact with the tracker, explore visualizations, and see anomalies in real time.
Notebooks
You can explore the detailed analysis and experimentation in the following notebook:
Visualization
📊 Visualizations
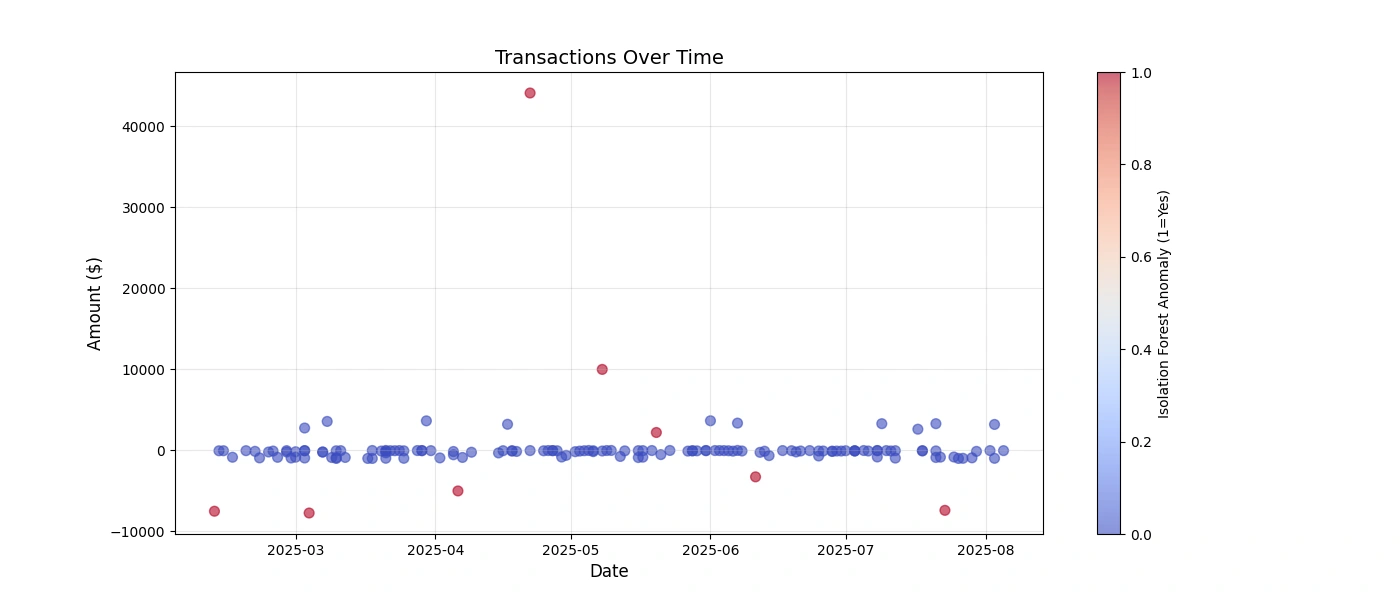
1. Amount vs Date (Anomalies highlighted)
Insight:
Red dots show anomalies detected by Isolation Forest.
These unusual transactions are scattered across time, showing no specific monthly pattern.
The Isolation Forest algorithm effectively flags outliers across the full range of dates, not just clusters.
2. Amount_Zscore vs Anomaly_ISO
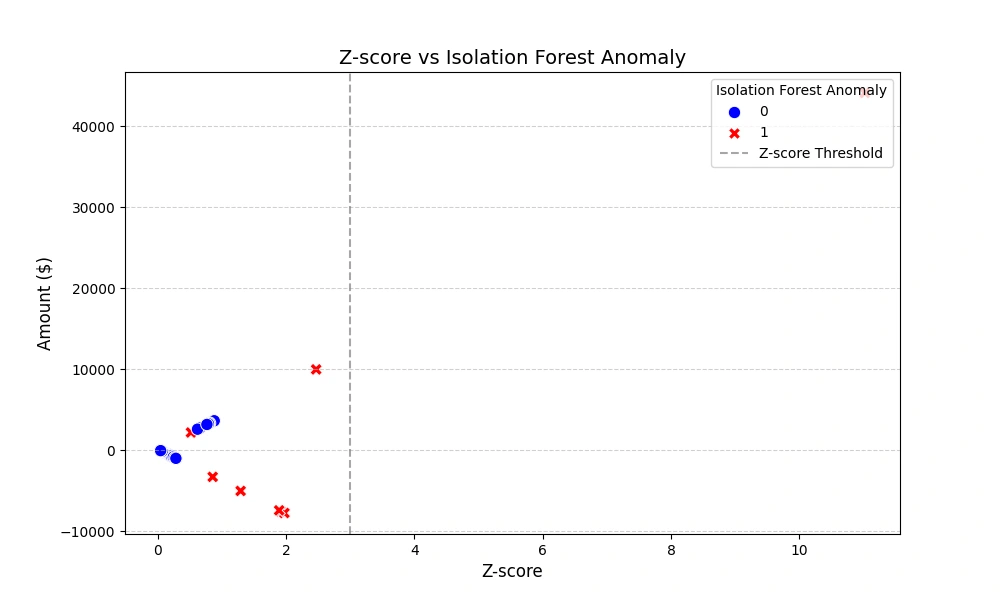
Insight:
Most transactions cluster around the z-score between 0 and 1.
Some Z-score points are flagged as anomalies (Tiny charges).
High Z-scores often correspond to anomalies, but not always.
The two methods partially overlap in anomaly detection.
Points beyond z=3 are extreme but may not always match ISO anomalies.
3. Category vs Anomaly_Zscore
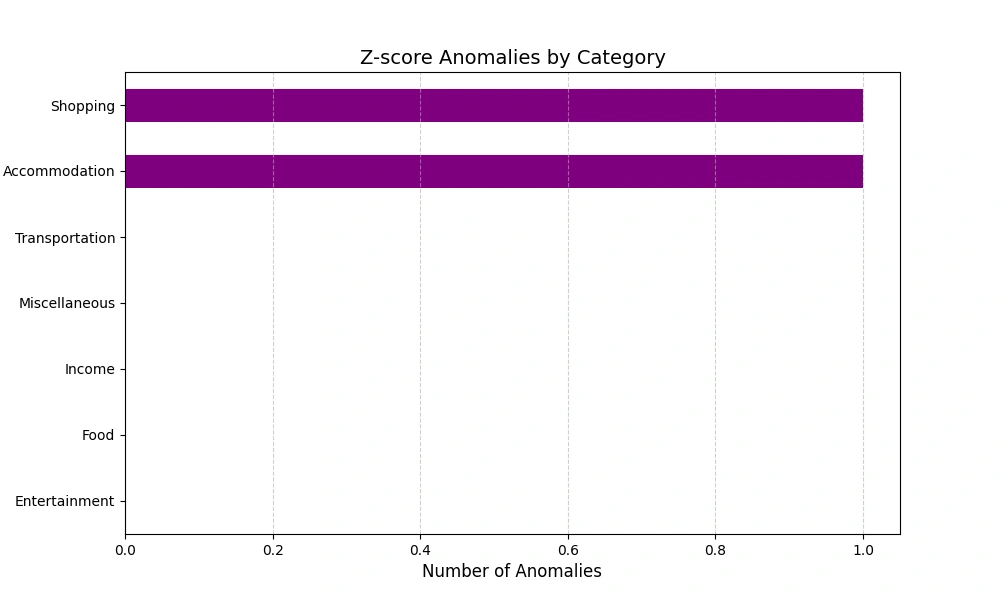
Insight
Z-score-flagged anomalies are exclusively in the Income category.
No anomalies detected in spending categories like food, shopping, or transportation.
High-income values significantly deviate from the dataset's average transaction behavior.
Like this project
Posted Aug 31, 2025
Created a finance tracker app using Python and anomaly detection techniques to identify irregular expenses and improve financial planning.
Likes
1
Views
4
Timeline
Jul 1, 2025 - Jul 30, 2025