Mental Health Data Analysis Interactive Dashboard
Kavyashree Sanjakadavu
Mental-Health-Data-Analysis-Interactive-Dashboard
This project explores survey responses on mental health and well-being.
It focuses on data cleaning, analysis, and visualization, with insights presented in an interactive dashboard created using Looker Studio.
🔍 Project Overview
Cleaned and pre-processed survey data for consistency
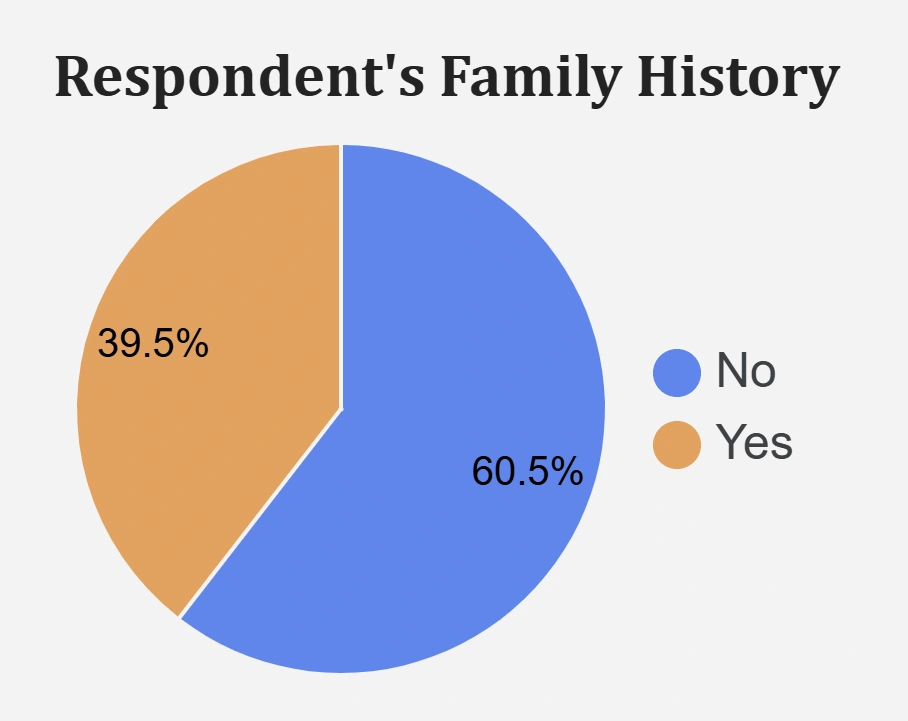
Analyzed key factors such as mental health awareness, family history, and willingness to seek treatment
Created meaningful charts and insights to highlight patterns
Built and published an interactive dashboard for exploration
##Live Dashboard: View on Looker Studio
🛠️ Tools & Technologies
Python → Pandas, Matplotlib, Seaborn
Looker Studio → Interactive visualizations
Google Colab → Code execution and documentation
📂 Data
This dataset contains anonymized survey responses related to mental health awareness, family history, workplace attitudes, and willingness to seek treatment.
Key Features (Columns):
Timestamp → Date of response
Gender → Self-reported gender
Country → Country of residence
Occupation → Employment type
self_employed → Whether the respondent is self-employed
family_history → Whether the respondent’s family has a history of mental illness
treatment → Whether the respondent sought treatment for mental illness
Days_Indoors → Time spent indoors during survey period
Growing_Stress → Reported stress levels
Changes_Habits → Whether they changed habits due to mental health
Mental_Health_History → Past record of mental health issues
Mood_Swings → Frequency of mood swings
Coping_Struggles → Difficulty in coping
Work_Interest → Effect on work interest
Social_Weakness → Social withdrawal or weakness
mental_health_interview → Comfort discussing mental health in an interview
care_options → Availability of mental health care options
View the full dataset here: Mental_Health_Dataset.csv
📓 Jupyter Notebook
You can view the full data cleaning and analysis notebook here:
View on nbviewer
📊 Sample Visualizations
Family History
Gender vs Treatment
Record Count
Like this project
Posted Aug 31, 2025
Analyzed mental health survey data and created an interactive dashboard using Looker Studio.
Likes
1
Views
2
Timeline
Jun 1, 2025 - Jun 15, 2025