Sales Dashboard Using Power BI
Shaik Reddy Shareef
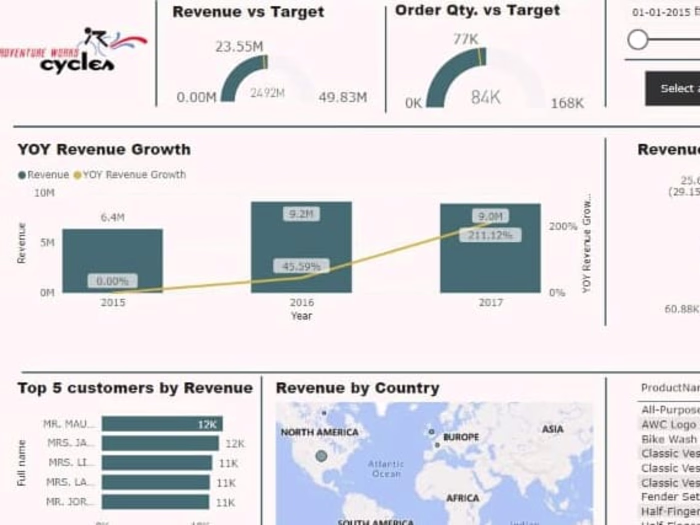
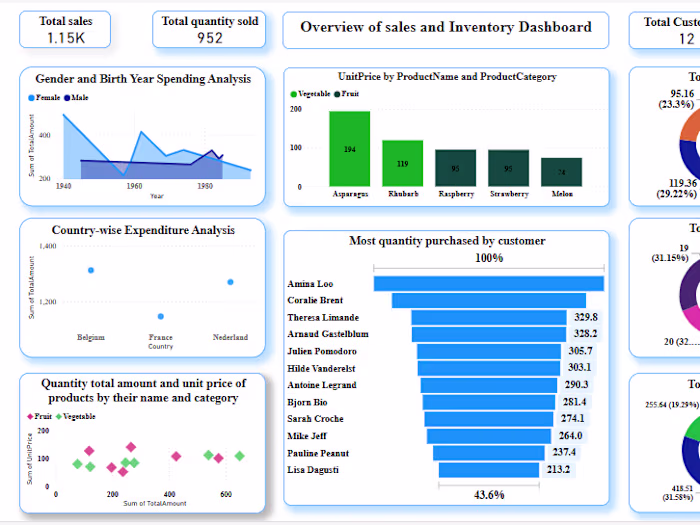
This project focuses on developing an interactive Sales Dashboard using Power BI and SQL Server to analyze and visualize sales performance. The dashboard provides key insights into revenue, sales trends, customer behavior, and product performance. Data is extracted from SQL Server using optimized queries, transformed for accuracy, and visualized in Power BI with dynamic filters, KPIs, and charts. The solution enables businesses to track sales growth, identify patterns, and make data-driven decisions efficiently.
Like this project
Posted Feb 15, 2025
Developed an interactive Sales Dashboard using Power BI and SQL Server to analyze sales trends, revenue, and customer behavior. Data was extracted, transformed,