
Varun Walekar
AI Data Analyst | Power BI & Python | Automated Reports
Ready for work
Varun is ready for their next project!
Built something I'm pretty proud of — Data Detective
An AI-powered anomaly investigation tool that turns dry data analysis into a noir detective case.
Under the hood:
→ Claude + 14 custom MCP tools
→ Isolation Forest for anomaly detection
→ Pearson correlation analysis
→ Results presented as an actual investigation report
No spreadsheets. No jargon. Just: "The suspect is outlier #47. Here's the evidence."
Live here → [https://claude.ai/public/artifacts/f8117dff-b531-4f31-8862-2a86a77137c2]
Full MCP server → https://github.com/Varu4/prodata-ai-mcp
#contralabs #AI #dataanalysis
2
4
263
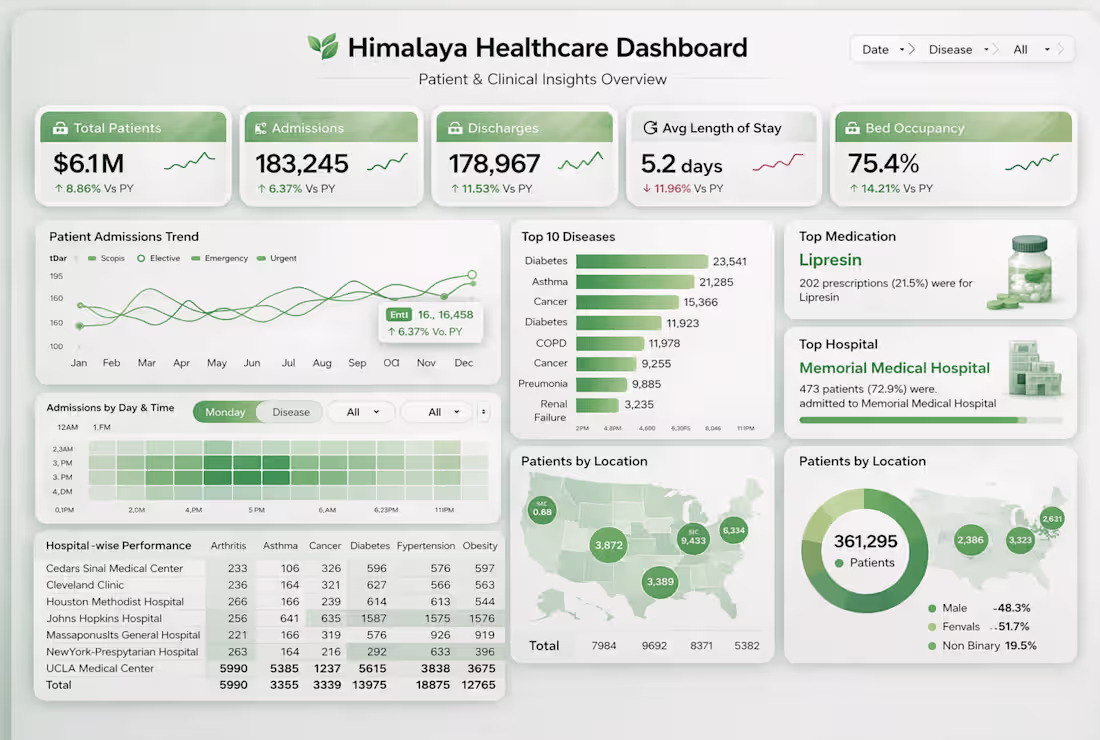
From Chaos to Clarity: Healthcare Dashboard in Power BI
1. Clean and interactive Power BI dashboard for tracking patient trends, hospital performance, and key healthcare metrics in one place.
2. A modern healthcare analytics dashboard built in Power BI to monitor admissions, diseases, and operational efficiency.
3. Turn raw healthcare data into meaningful insights with this intuitive and fully interactive Power BI dashboard.
0
53
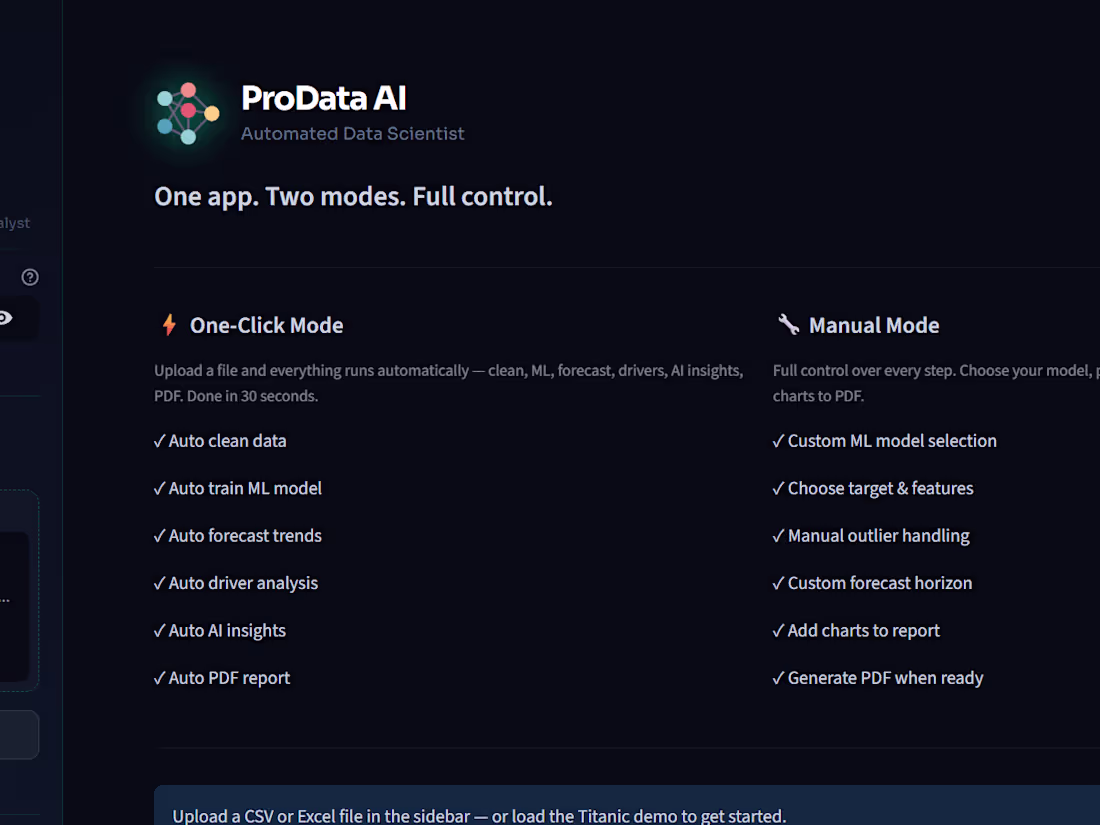
ProData AI — Automated Data Science Platform
Built ProData AI, an automated data science platform developed entirely with Streamlit.
It is designed to help users transform raw datasets into actionable business insights in seconds.
🚀 What it does
One-Click Mode
Upload any CSV or Excel file and the full pipeline runs automatically in under 30 seconds:
Data cleaning & preprocessing
AutoML (6 models trained simultaneously)
30-day forecasting using Prophet
Business driver analysis with Explainable AI (XAI)
AI-generated insights using Anthropic Claude
PDF report generation
Manual Mode
Provides full control over each stage of the data science workflow for advanced users.
🛠 Tech Stack
Streamlit — complete UI and app framework
scikit-learn — AutoML pipeline
Prophet — time-series forecasting
Anthropic Claude API — AI insights & chat
Plotly — interactive visualizations
fpdf2 — PDF report generation
Ideal for:
business analysts
startups
small businesses
automated reporting workflows
freelance analytics projects
Open to freelance collaborations and custom dashboard / AI reporting solutions.
5
4
287
AI Data Scientist
1
3
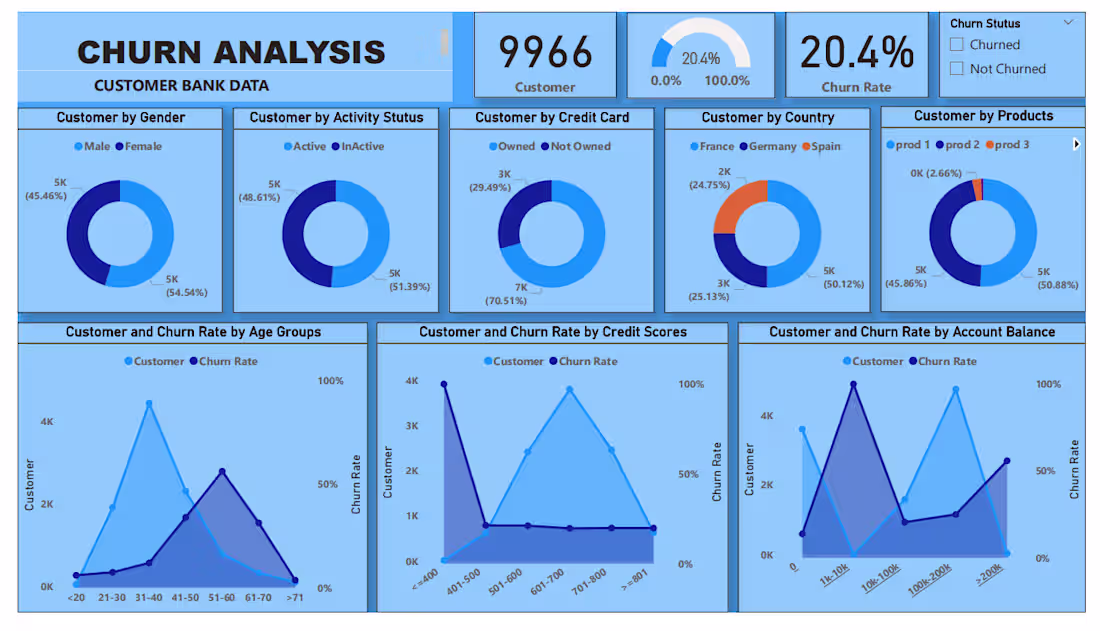
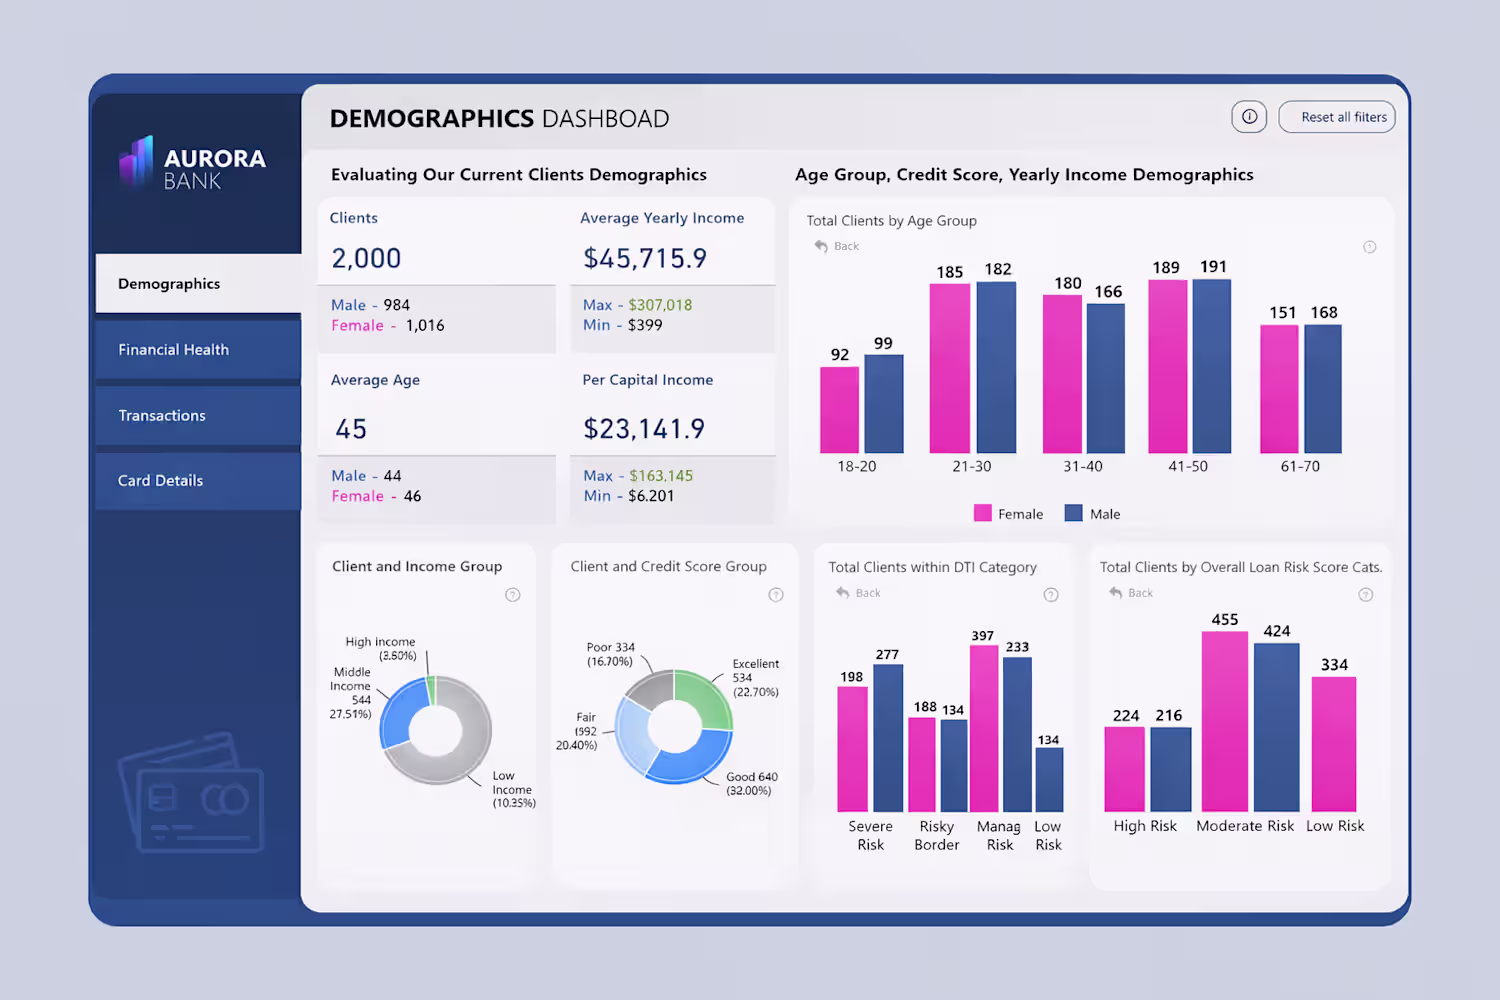
📊 Customer Churn Analysis Dashboard | Power BI Project
Designed and developed an interactive Power BI dashboard to analyze customer churn for a banking dataset with over 9,900 customers.
The primary objective was to identify key patterns and factors influencing customer attrition and deliver actionable insights to support effective retention strategies.
🔍 Key Features:
Visualization of critical KPIs such as churn rate, account balance, and activity status
Customer segmentation based on demographics and behavior
Interactive filters for detailed comparison and analysis
Clear insights into high-risk customer groups
📈 Impact:
This project enhanced understanding of customer behavior and empowered stakeholders to make data-driven decisions to reduce churn and improve customer engagement.
Tools Used: Power BI, DAX,Data Visualization
0
121
I built an AI-powered Data Analyst that turns raw CSV, Excel, or SQL data into executive-ready insights.
✅ Automatic EDA & outlier detection
✅ Visual charts & insights
✅ Executive PDF report
✅ Business recommendations
✅ Voice-based summaries
This isn’t a dashboard —
it’s an AI analyst for founders and teams who want fast decisions.
🎥 Watch the demo video
📩 Message me “AI Analyst” for access or a custom build
#AI #DataAnalytics #Automation #BusinessIntelligence #Streamlit
1
4
387
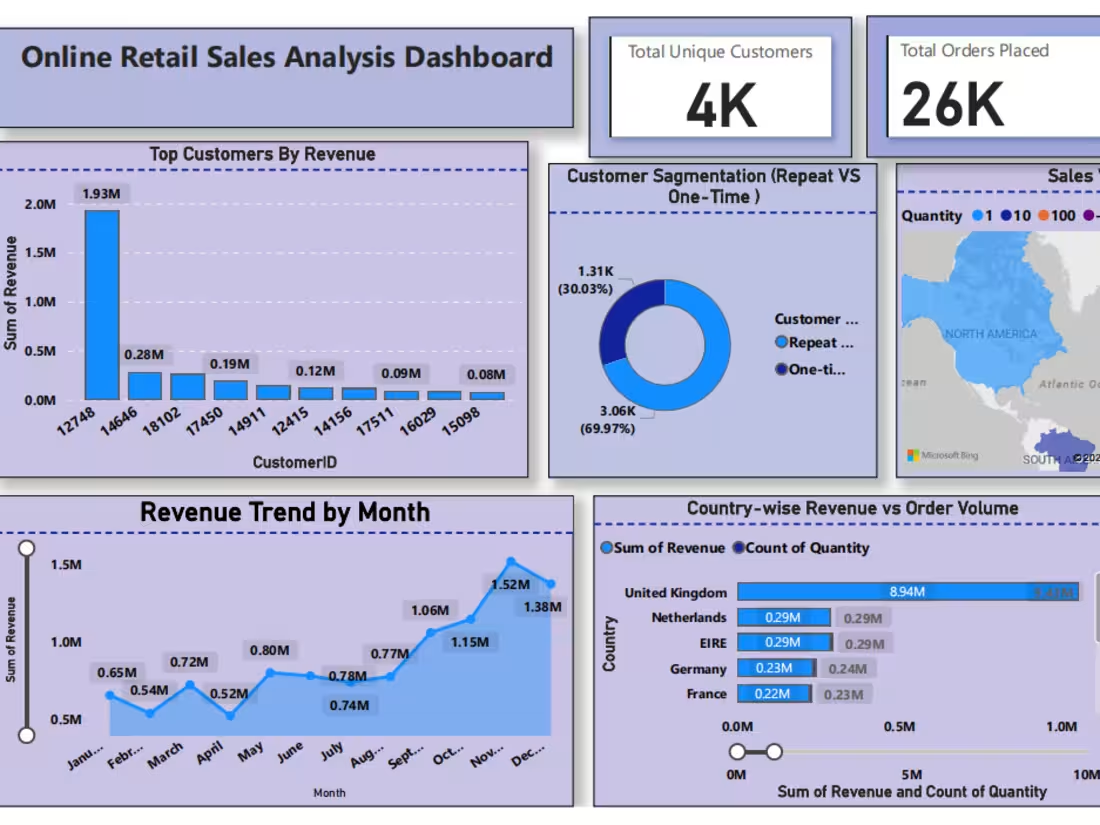
Online Retail Sales Analysis Dashboard
I built this interactive Power BI dashboard to analyze online retail sales performance and customer behavior.
Key insights covered:
📈 Monthly revenue trend and seasonality analysis
👥 Customer segmentation (Repeat vs One-time customers)
🌍 Country-wise sales volume and revenue comparison
💰 Business KPIs: Total Sales Revenue, Total Orders, Total Customers & Average Order Value
🏆 Identification of top revenue-generating customers
Tools & Skills:
Power BI | DAX | Data Modeling | Data Cleaning | Data Visualization
This dashboard helps businesses quickly understand where revenue comes from, who their best customers are, and how sales perform over time.
Open to freelance projects related to Power BI dashboards, sales analysis, and business intelligence reporting.
4
3
446