
UX/UI designer and AI creative for founders


Innovative AI Product Designer & Strategist

Innovative AI Product Designer & Strategist


UX UI designer / Multilingual (SP, EN, IT)
UX UI designer / Multilingual (SP, EN, IT)


Brand Designer | Visual Facilitator



Product Designer | Web3, Fintech & DeFi | Framer & Webflow
- 5.0
- Rating
- 8
- Followers
Product Designer | Web3, Fintech & DeFi | Framer & Webflow


Most fintech apps show how much you’ve saved.
They don’t show what it’s costing you.
Saving for travel can delay debt payoff.
So I explored a better approach: A goal-based savings experience where multiple goals compete for the same income, and users can see the trade-offs clearly.
I used AI across my workflow:
Perplexity to ground the scenario
ChatGPT to refine flows and edge cases
Figma Make to shape early directions
Cursor to prototype the interaction locally.
Then I designed the experience in Figma, focusing on clarity and decision-making.
Key ideas:
• Multiple goals with clear priorities
• A trade-off slider showing how timelines shift
• Scroll interactions that reveal goals progressively
Still refining, but the goal is simple: Help users make smarter financial decisions, not just track savings.
4
175

I designed a B2B Energy Management Dashboard for factory operations teams.
The goal was simple: help managers identify where energy is wasted across multiple sites and machines, and decide what to fix within seconds.
The solution focuses on prioritised alerts, clear multi-site KPIs, layered data exploration, and actionable recommendations that turn complex energy data into operational decisions.
#UXDesign #ProductDesign #DashboardDesign
6
1
197

Project: B2B SaaS Onboarding Redesign
Context: 14 day trial, multi user analytics and CRM product
Challenge
Teams signed up but never activated. Admins felt overwhelmed by configuration. Workspaces expired without integrations.
Approach
I defined the core aha moment as “see your own revenue or pipeline data inside a live dashboard”.
Everything in onboarding was designed to drive that outcome.
• Welcome screen asks for user goal, not company details
• Personalised checklist based on role and objective
• Sample data to demonstrate value before setup
• Linear, skippable setup with clear progress and time expectations
• Post integration prompt to invite teammates and drive adoption
Result: A guided experience that reduces cognitive load, clarifies what done means, and aligns the entire setup around first value, not feature exposure
3
139

Shopify freelancer for D2C and B2B brands, fixed prices
- 2x
- Hired
- 5.0
- Rating
- 12
- Followers
Shopify freelancer for D2C and B2B brands, fixed prices

AI Creative Professional |Art Direcor |Sr. Product Desiger


Product Designer with 5+ years of experience in Fintech, B2B
Product Designer with 5+ years of experience in Fintech, B2B
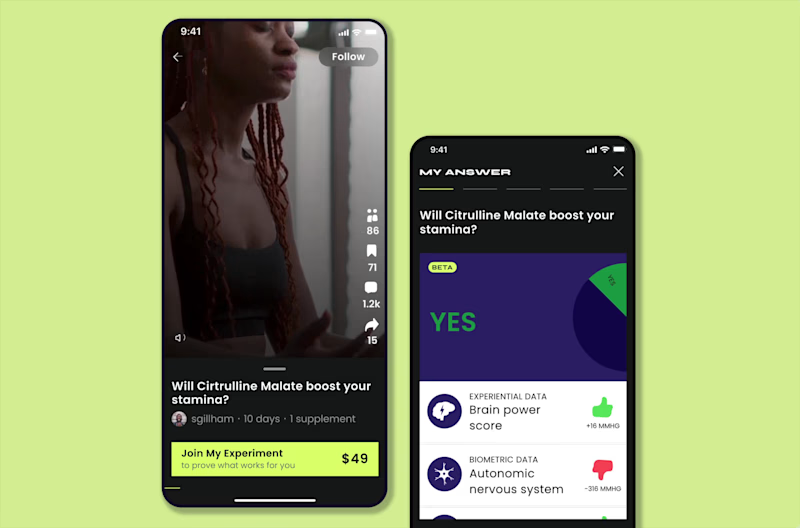
Building trust into a skeptical market: a biohacking social app.
(https://dariamorozova.framer.website/MOZA)MOZA is a US startup building a biohacking social platform — a place to run supplement "self-experiments," share results on video, and vote on what actually works.
Outcome
Working solo on the design (with a design lead reviewing and joining client calls), I delivered the full mobile app and a complete UI kit built from scratch.
I validated the design with 10–15 of the client's creators during the project. After handoff, I had no access
to production analytics, so this case is honest about what I designed and tested, not about post-launch numbers I can't verify.
Full product design, 0→1
Every flow, screen, and state: from onboarding through experiments, results, shop, and subscriptions.
UI kit from scratch
Colours, components, product patterns (self-experiment cards, subscription plans, the "My Answer" result visualisations), an illustration set that the team could build and scale on.
1
105
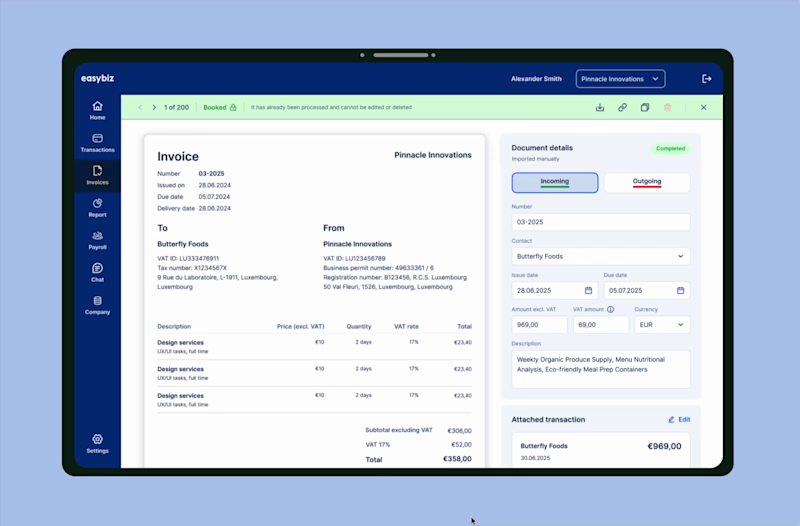
Re-architecting B2B invoicing: from MVP to daily driver
(https://dariamorozova.framer.website/invoices)EasyBiz helps SMEs in Luxembourg register and run their business. I was the sole designer on the product and owned invoicing end-to-end: from MVP 1.0 through the redesign that followed as we grew to our first 100 users over 2025 and saw what broke at scale.
As a founding designer, I owned invoicing end-to-end, validated with real users, the back-office team, and support feedback as we grew to our first 100 users over 2025.
Outcome
I rebuilt EasyBiz invoicing from a card-based MVP into a flow that holds up at real volume. Measured with the support team after release, across all 100 users:
−30% support tickets in the invoicing area
Users stopped forgetting to attach transactions. The single biggest recurring ticket type dropped off.
~2× faster booking for the back-office team
Staff no longer had to chase users to fix or attach transactions, or hunt for half-filled invoices (back-office estimate).
1
139
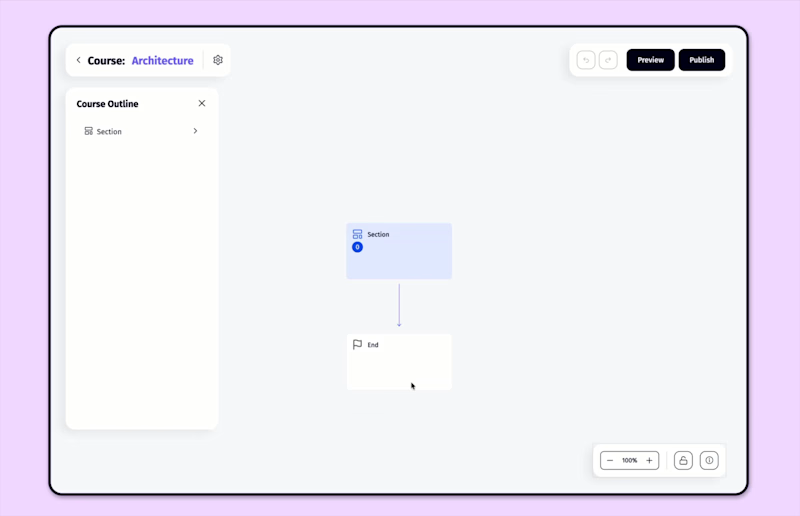
Rethinking course-building as a canvas, not a form
(https://dariamorozova.framer.website/seturon)Seturon is an EdTech startup in Luxembourg building a platform where companies, lecturers, and solo experts structure their knowledge into courses and sell them.
I built the brand from scratch, the design system, six pages of the marketing site, and go-to-market materials.
I redesigned the student and admin panels around the new system, including a full mobile experience for students.
Outcome
A course builder, rebuilt from a form into a canvas. I designed the course constructor from the ground up across two iterations: replacing a linear, step-by-step builder with a canvas-based editor inspired by Miro and FigJam.
Measured with the team and with users (we were in direct contact with users, so we had real product data):
~30 min → ~5 min to build a course skeleton
A 5–6-block non-linear course that took ~30 minutes to set up could now be sketched in ~5 minutes using drag-and-drop, dropdowns, and nested "Section" blocks.
−42% support tickets related to the builder
tracked on the team's ClickUp board by ticket topic, after the mechanics and bugs were fixed.
~34% of users created more than two courses
In the first months after the MVP, it was a sign that the builder was something people came back to.
4–4.5 / 5 in public reviews
The product is frequently praised as user-friendly and understandable even for non-technical users.
(From public reviews)
1
132
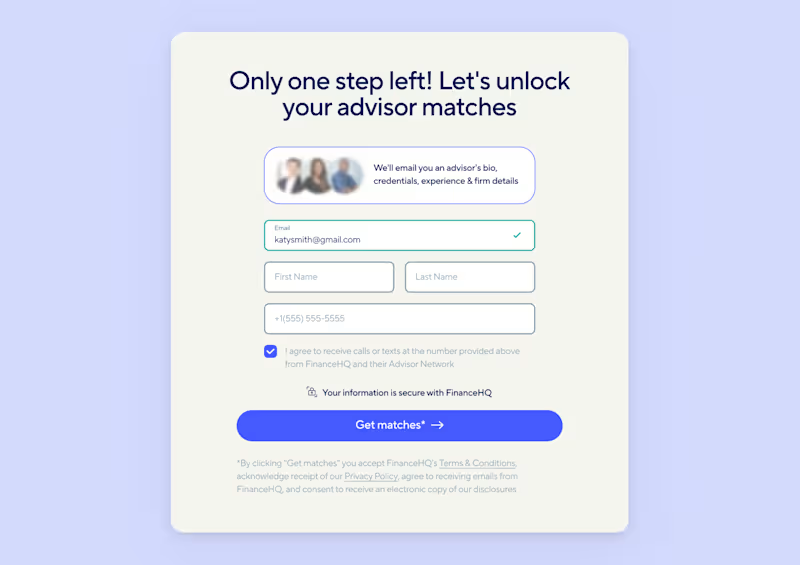
Rebuilding trust in a financial advisor journey
(https://dariamorozova.framer.website/Finance-HQ)FinanceHQ matches people with pre-screened financial advisors. On paper, the product was competitive, but users were leaving at every step of a long lead flow, with drop-off hitting 70% at the moment they were asked for financial details. I joined mid-project, inherited the flow and visual direction, and led the research and redesign that followed.
As a product designer, I worked under a design lead who reviewed direction and owned the client relationship. I inherited the visual language and lead flow, then led the research and redesign that improved conversion after launch.
Outcome
Measured from the client's production analytics after launch, validated with moderated call-throughs during design and A/B tests in production:
+60% conversions
The final step reassured users about data security, and the client's post-launch analytics showed it in conversion.
−4 min time to complete
Range toggles across five stages saved users 4–5 minutes by eliminating exact input and reducing cognitive load.
8-step flow
The flow was condensed to eight steps, completable in under a minute, down from a fragmented, drop-off-heavy process.
40-sec testimonial engagement
On the first step, the longest dwell time in the flow and its key trust moment.
1
147