
Professional Accountant | Bookkeeping, Financial Reporting
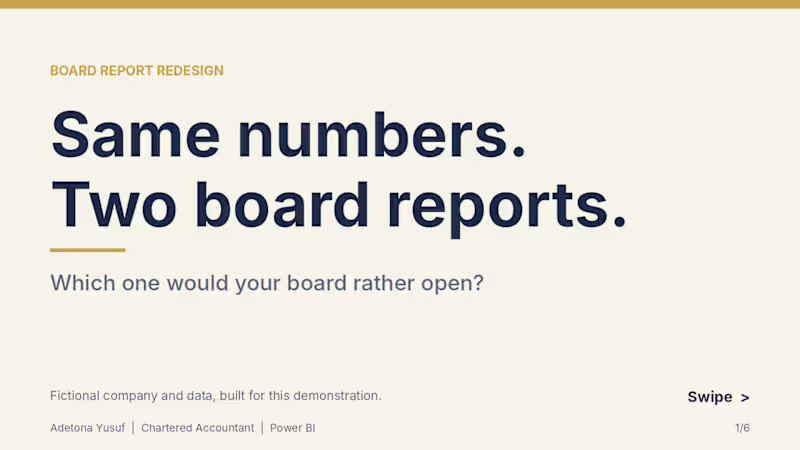
Project title: Board Report Redesign: Q3 Performance Pack (Power BI)
Same financial data, redesigned from a plain Word report into a one-page Power BI board view.
The problem
Board and management reports are often full of accurate numbers that nobody reads closely. Tables, long paragraphs and default charts make people hunt for the headline.
What I did
To show my approach, I built a fictional company’s Q3 board report two ways from the same Excel workbook: a typical plain Word version, and a redesigned one-page Power BI view.
What I changed
• Key figures (revenue, profit, closing cash, variance to budget) placed first
• A waterfall that takes cash from opening balance to closing cash
• Clear chart titles, with units where they apply
• One colour system applied across every visual
• All figures tie back to a single workbook, with DAX measures checked against it
Deliverables in this sample
• Plain “before” report (Word, 8 pages)
• Redesigned Power BI board view (PDF)
• Source workbook structure and a custom navy and gold theme
Note: The company, figures and report are fictional, created only to demonstrate my approach. No real client data is used.
What I can do for you
I design board packs, investor decks and monthly management reports for SMEs and finance teams, in Power BI and Excel. If your reports get skimmed instead of read, message me.
1
0
205

My latest build turns that chaos into a sleek, interactive Insurance Application Summary Dashboard built for speed, insight, and control.
Traditional reports hide insights behind endless spreadsheets.
This dashboard flips the script, it reveals the story instantly:
Clarity isn’t cosmetic, it’s profit.
Good reporting tells what happened.
Creative reporting shows where to act next.
By blending storytelling, interactivity, and business logic, this becomes a true decision engine for underwriting teams.
If approvals still take 75 days, your reporting is the bottleneck.
I build data products that turn chaos into profit-driving clarity.
Now open to projects merging data strategy + design + visualization for faster, smarter decisions.
📊 Explore the vision.
💬 DM to discuss your toughest data challenge.
1
210

Dynamic Financial Statements with Excel Cube Formulas
I've released an analytics-engineering project demonstrating how to build fully customizable financial reports (I/S, B/S, C/F) using Excel Cube Formulas linked to a Power Pivot data model.
Core Value: Provides finance teams with unrestricted report formatting (solving the Pivot Table layout problem) while ensuring data integrity through a DAX-powered model. The entire report is dynamic, automatically updating for year-to-year comparisons.
Stack: Power Query, Power Pivot, DAX, Excel Cube Formulas.
View the code and detailed explanation: [https://github.com/adetonayusuf/Financial_Statement_with_Cube_Formula]
What's your favorite advanced Excel trick?
1
229

Just completed my end-to-end data engineering project: Customer Weather Demand Analysis
This project demonstrates a full data pipeline, from multi-source data ingestion (customer dumps & real-time weather APIs) to business intelligence. I used Python and Terraform to provision and orchestrate Google Cloud Platform (GCP) resources, transformed the data in Snowflake following a Medallion Architecture, and built a suite of dashboards in Power BI to deliver key insights on how weather impacts customer demand.
Check out the full project code and detailed README on
GitHub: https://github.com/adetonayusuf/maxi_sale_forecast
2
209


Content Strategist | Research-Backed Growth| Architect
- 1x
- Hired
- 5.0
- Rating
- 37
- Followers
Content Strategist | Research-Backed Growth| Architect


Data Analyst | Leveraging Data to uncover Insights.
Data Analyst | Leveraging Data to uncover Insights.


View more →

Business Analyst | Turning Ideas into Structure & Strategy
Business Analyst | Turning Ideas into Structure & Strategy


Head of Product Design · Fintech & Emerging Tech ·

Head of Product Design · Fintech & Emerging Tech ·


Data Analyst, Product Analyst, Framer Designer
- 1x
- Hired
- 5.0
- Rating
- 12
- Followers
Data Analyst, Product Analyst, Framer Designer
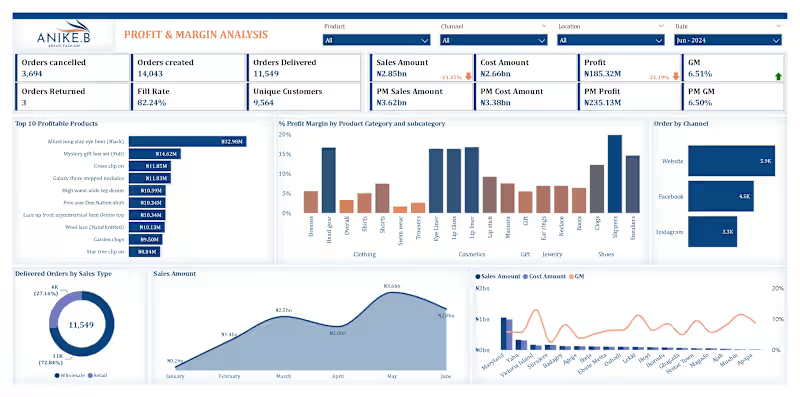
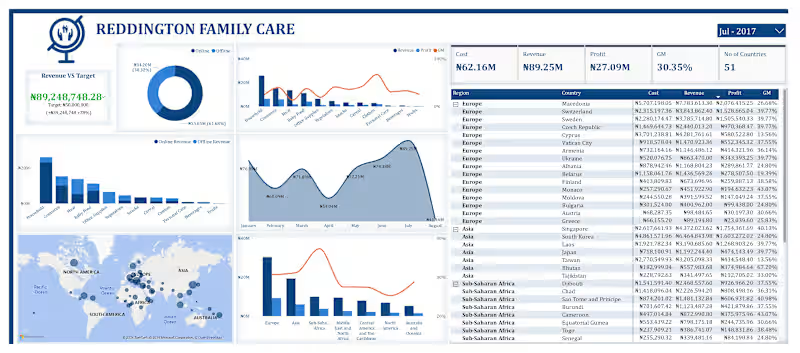
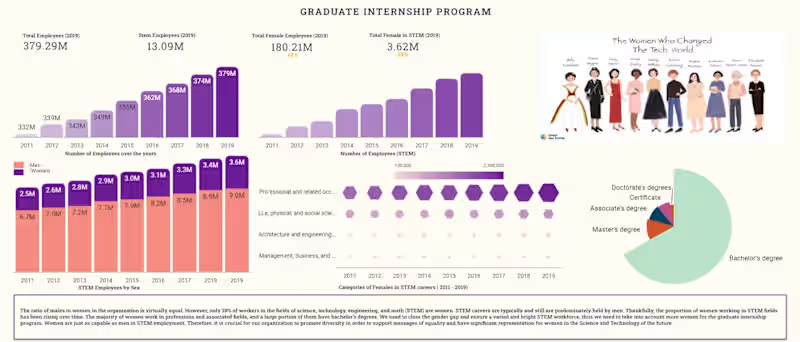
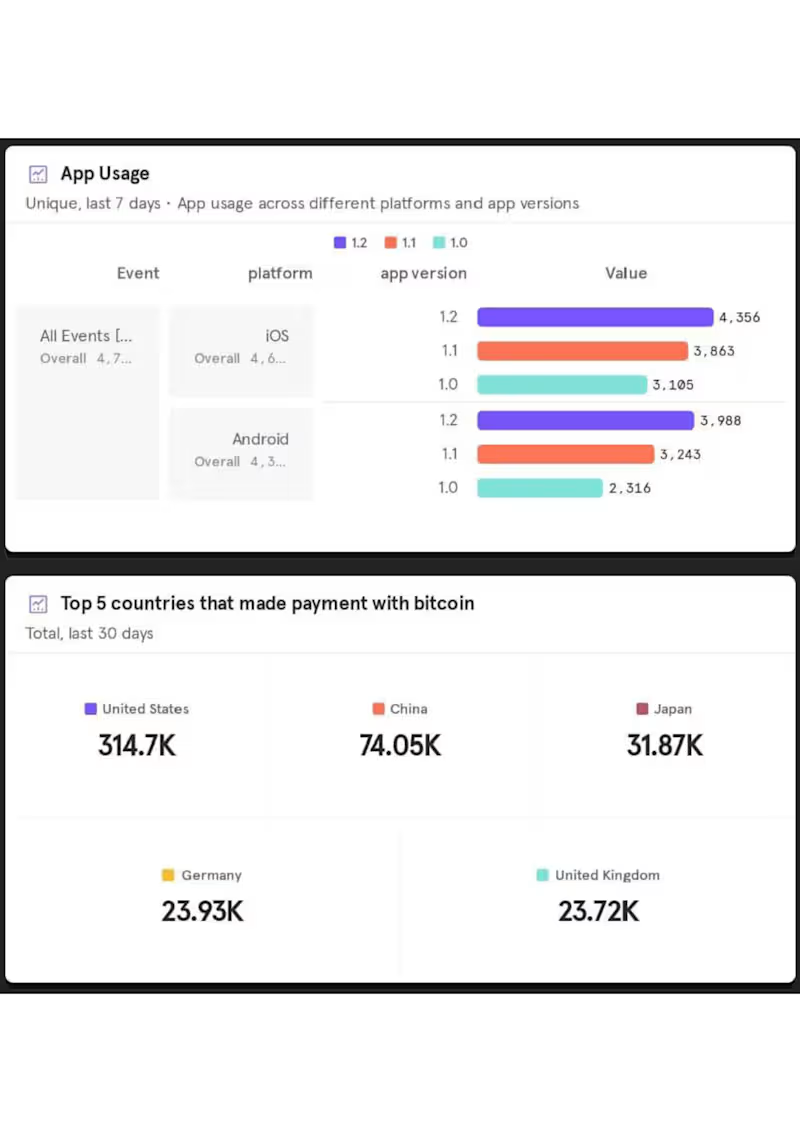

Transforming raw data into organized and actionable insights
Transforming raw data into organized and actionable insights


Data Analyst
Data Analyst



View more →