
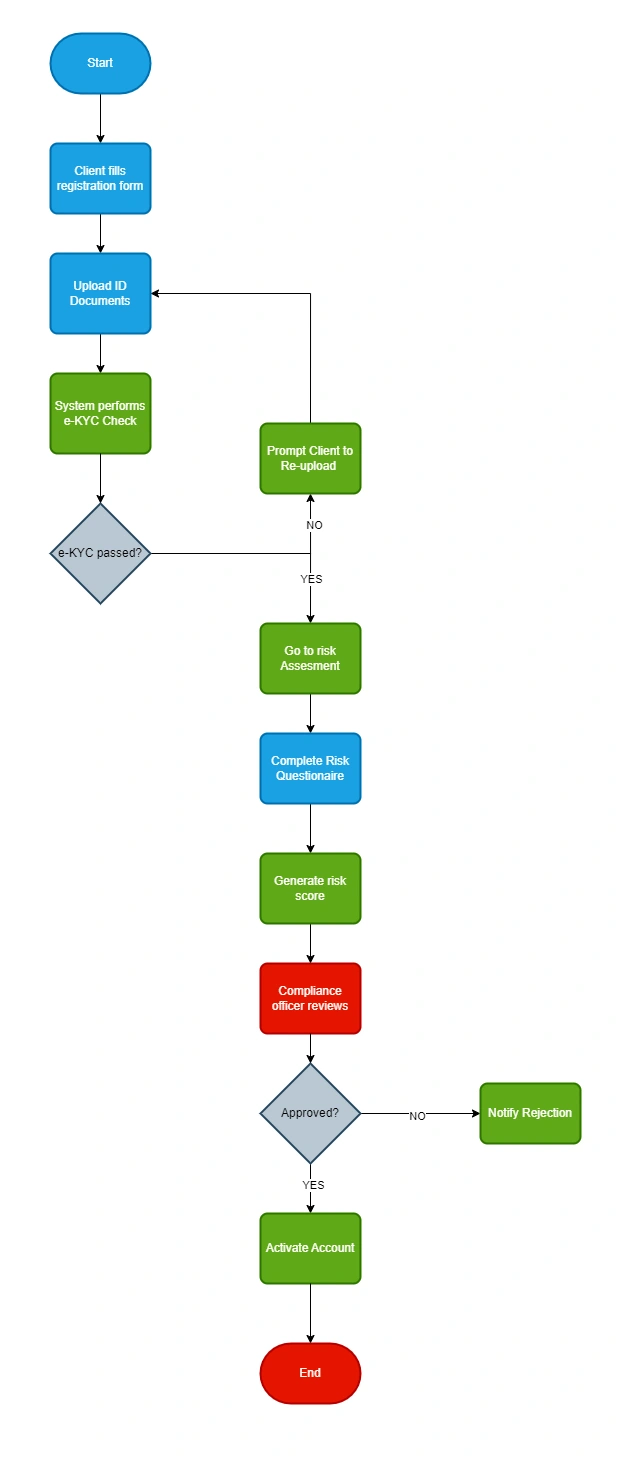
🔄 Business Process Flowchart: Investment Portfolio Management System
Overview
This flowchart visualizes the end-to-end process of managing client investment portfolios — from onboarding and data entry to performance monitoring and reporting. The goal was to simplify complex operations, clarify stakeholder roles, and improve process efficiency across departments.
Process
Requirement Gathering: Collaborated with business stakeholders to understand the investment management workflow and data touchpoints.
Process Analysis: Identified redundant steps and bottlenecks in transaction validation and performance tracking.
Flowchart Design: Created a clear visual process map using Lucidchart to depict system interactions, data flow, and approval hierarchy.
Optimization Recommendation: Proposed streamlined steps for faster data verification and reporting automation.
Deliverables
Investment Portfolio Flowchart (Lucidchart)
Process Documentation (Draft Notes + Key Insights)
Impact
The redesigned process provided management with a unified view of workflow dependencies, enabling quicker communication between the operations and data teams — reducing manual reporting time by 25%.
Tools Used
Lucidchart · Microsoft Excel · Power BI
1 like · 10 views · Nov 13, 2025
Created an investment portfolio management flowchart to improve efficiency.


