Investment Portfolio Performance Tracking & KPI Reporting
Priscilla Oluwatobi
💹 Investment Portfolio Case Study: Performance Tracking & KPI Reporting
Overview
This project centered on building an interactive investment performance tracking solution for a financial services firm. The goal was to automate reporting, visualize portfolio performance, and enable management to make data-driven investment decisions.
Process
Requirement Gathering: Conducted stakeholder meetings to define investment KPIs — ROI, risk exposure, portfolio diversification, and sector performance.
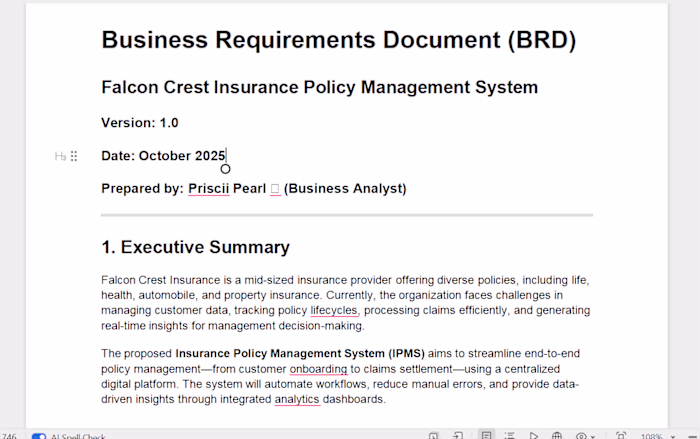
Business Analysis & Documentation: Created a comprehensive requirements document outlining data sources, report structure, and visualization goals.
Data Modeling: Cleaned and structured transaction data in Excel, leveraging Power Query for transformation.
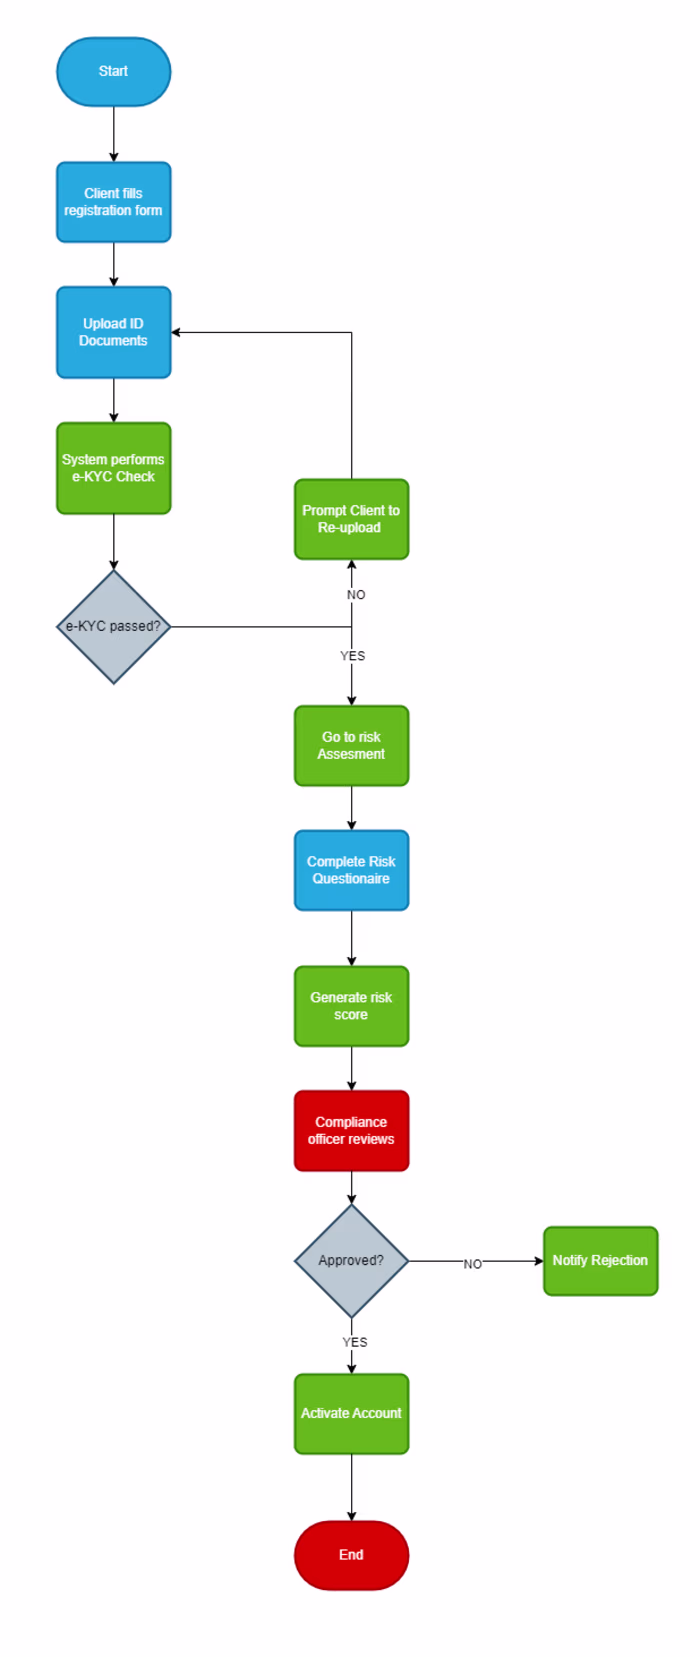
Wireframing: Designed dashboard blueprints in Lucidchart to define layout and data flow.
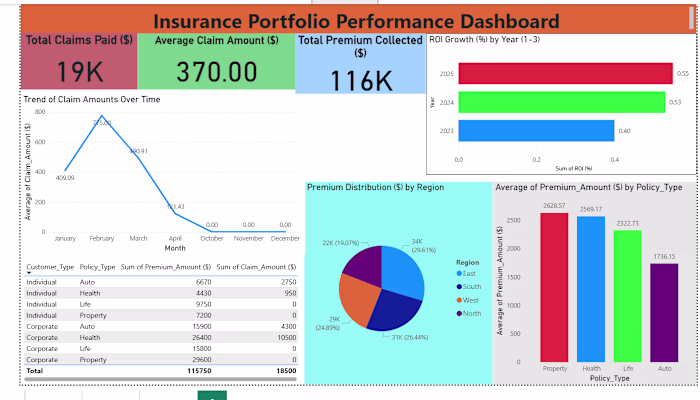
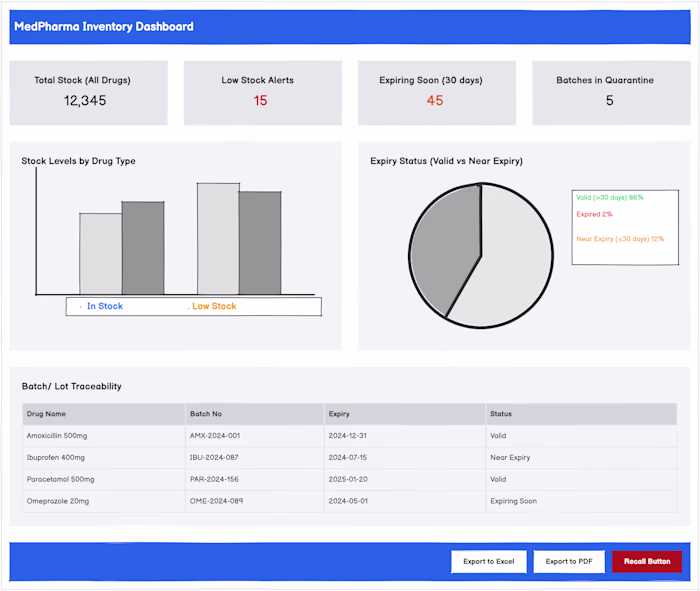
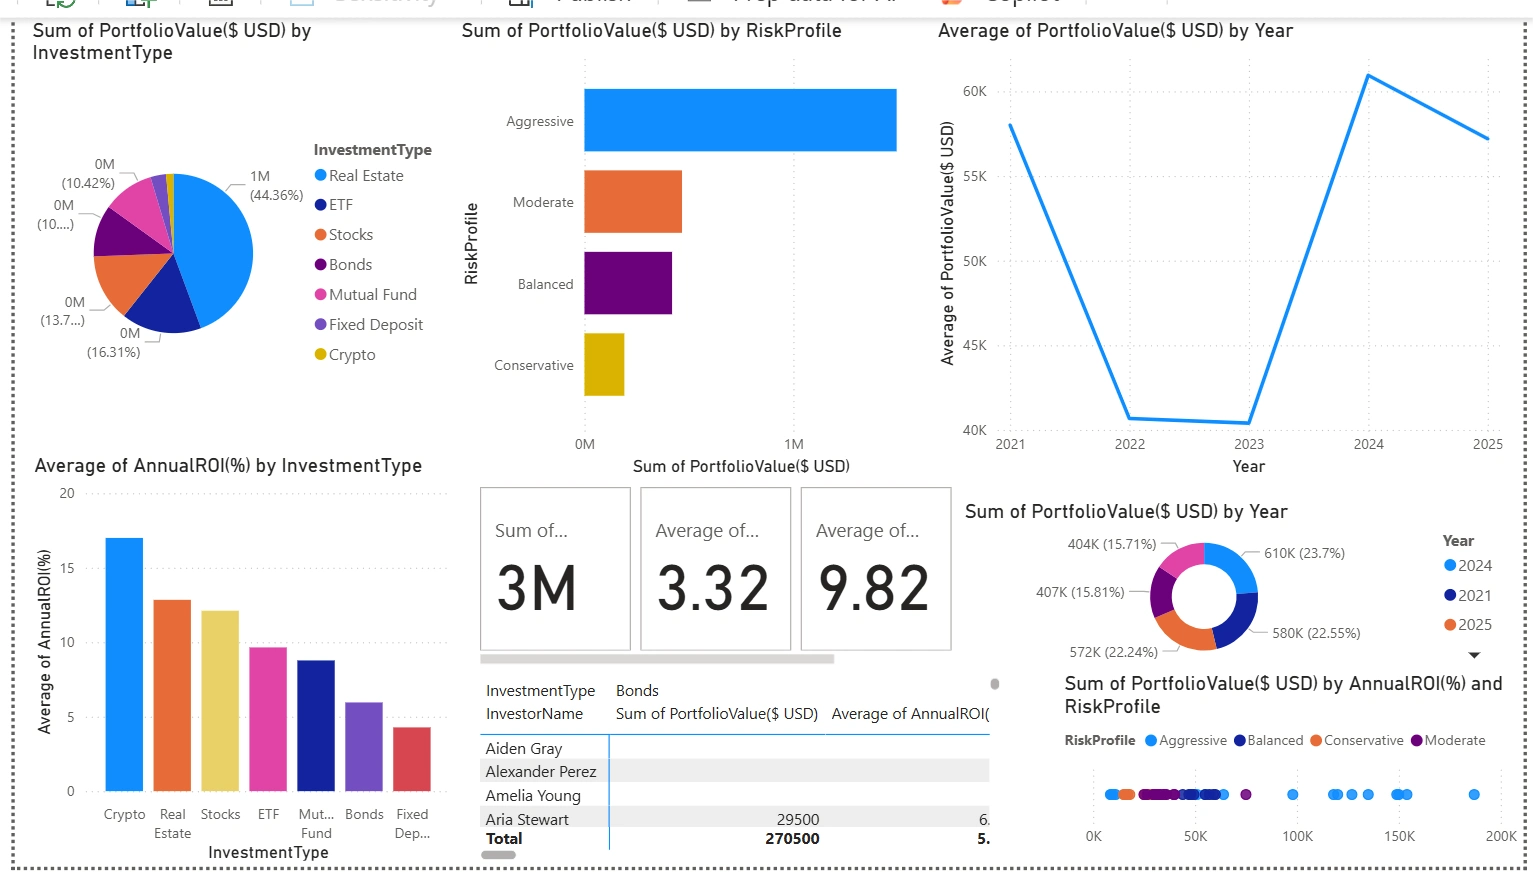
Dashboard Development: Built a Power BI dashboard with interactive visuals for tracking ROI trends, risk scores, and portfolio distribution.
Reporting & Recommendations: Delivered insights that highlighted underperforming sectors and guided investment rebalancing.
Deliverables
Requirements Specification Document
Data Model & Power Query Setup
Power BI Dashboard (ROI, Risk, and Sector Performance)
Wireframe Blueprint
Summary Insight Presentation
Impact
The firm achieved a 10% improvement in investment decision accuracy through real-time visibility into performance metrics and risk exposure, leading to more strategic asset allocation.
Tools Used
Power BI · Excel · Power Query · Lucidchart
Like this project
Posted Nov 13, 2025
Built an interactive investment performance tracking solution for a financial services firm.