NBA ANALYTICS HUB
Atanranshe Oluwabusola
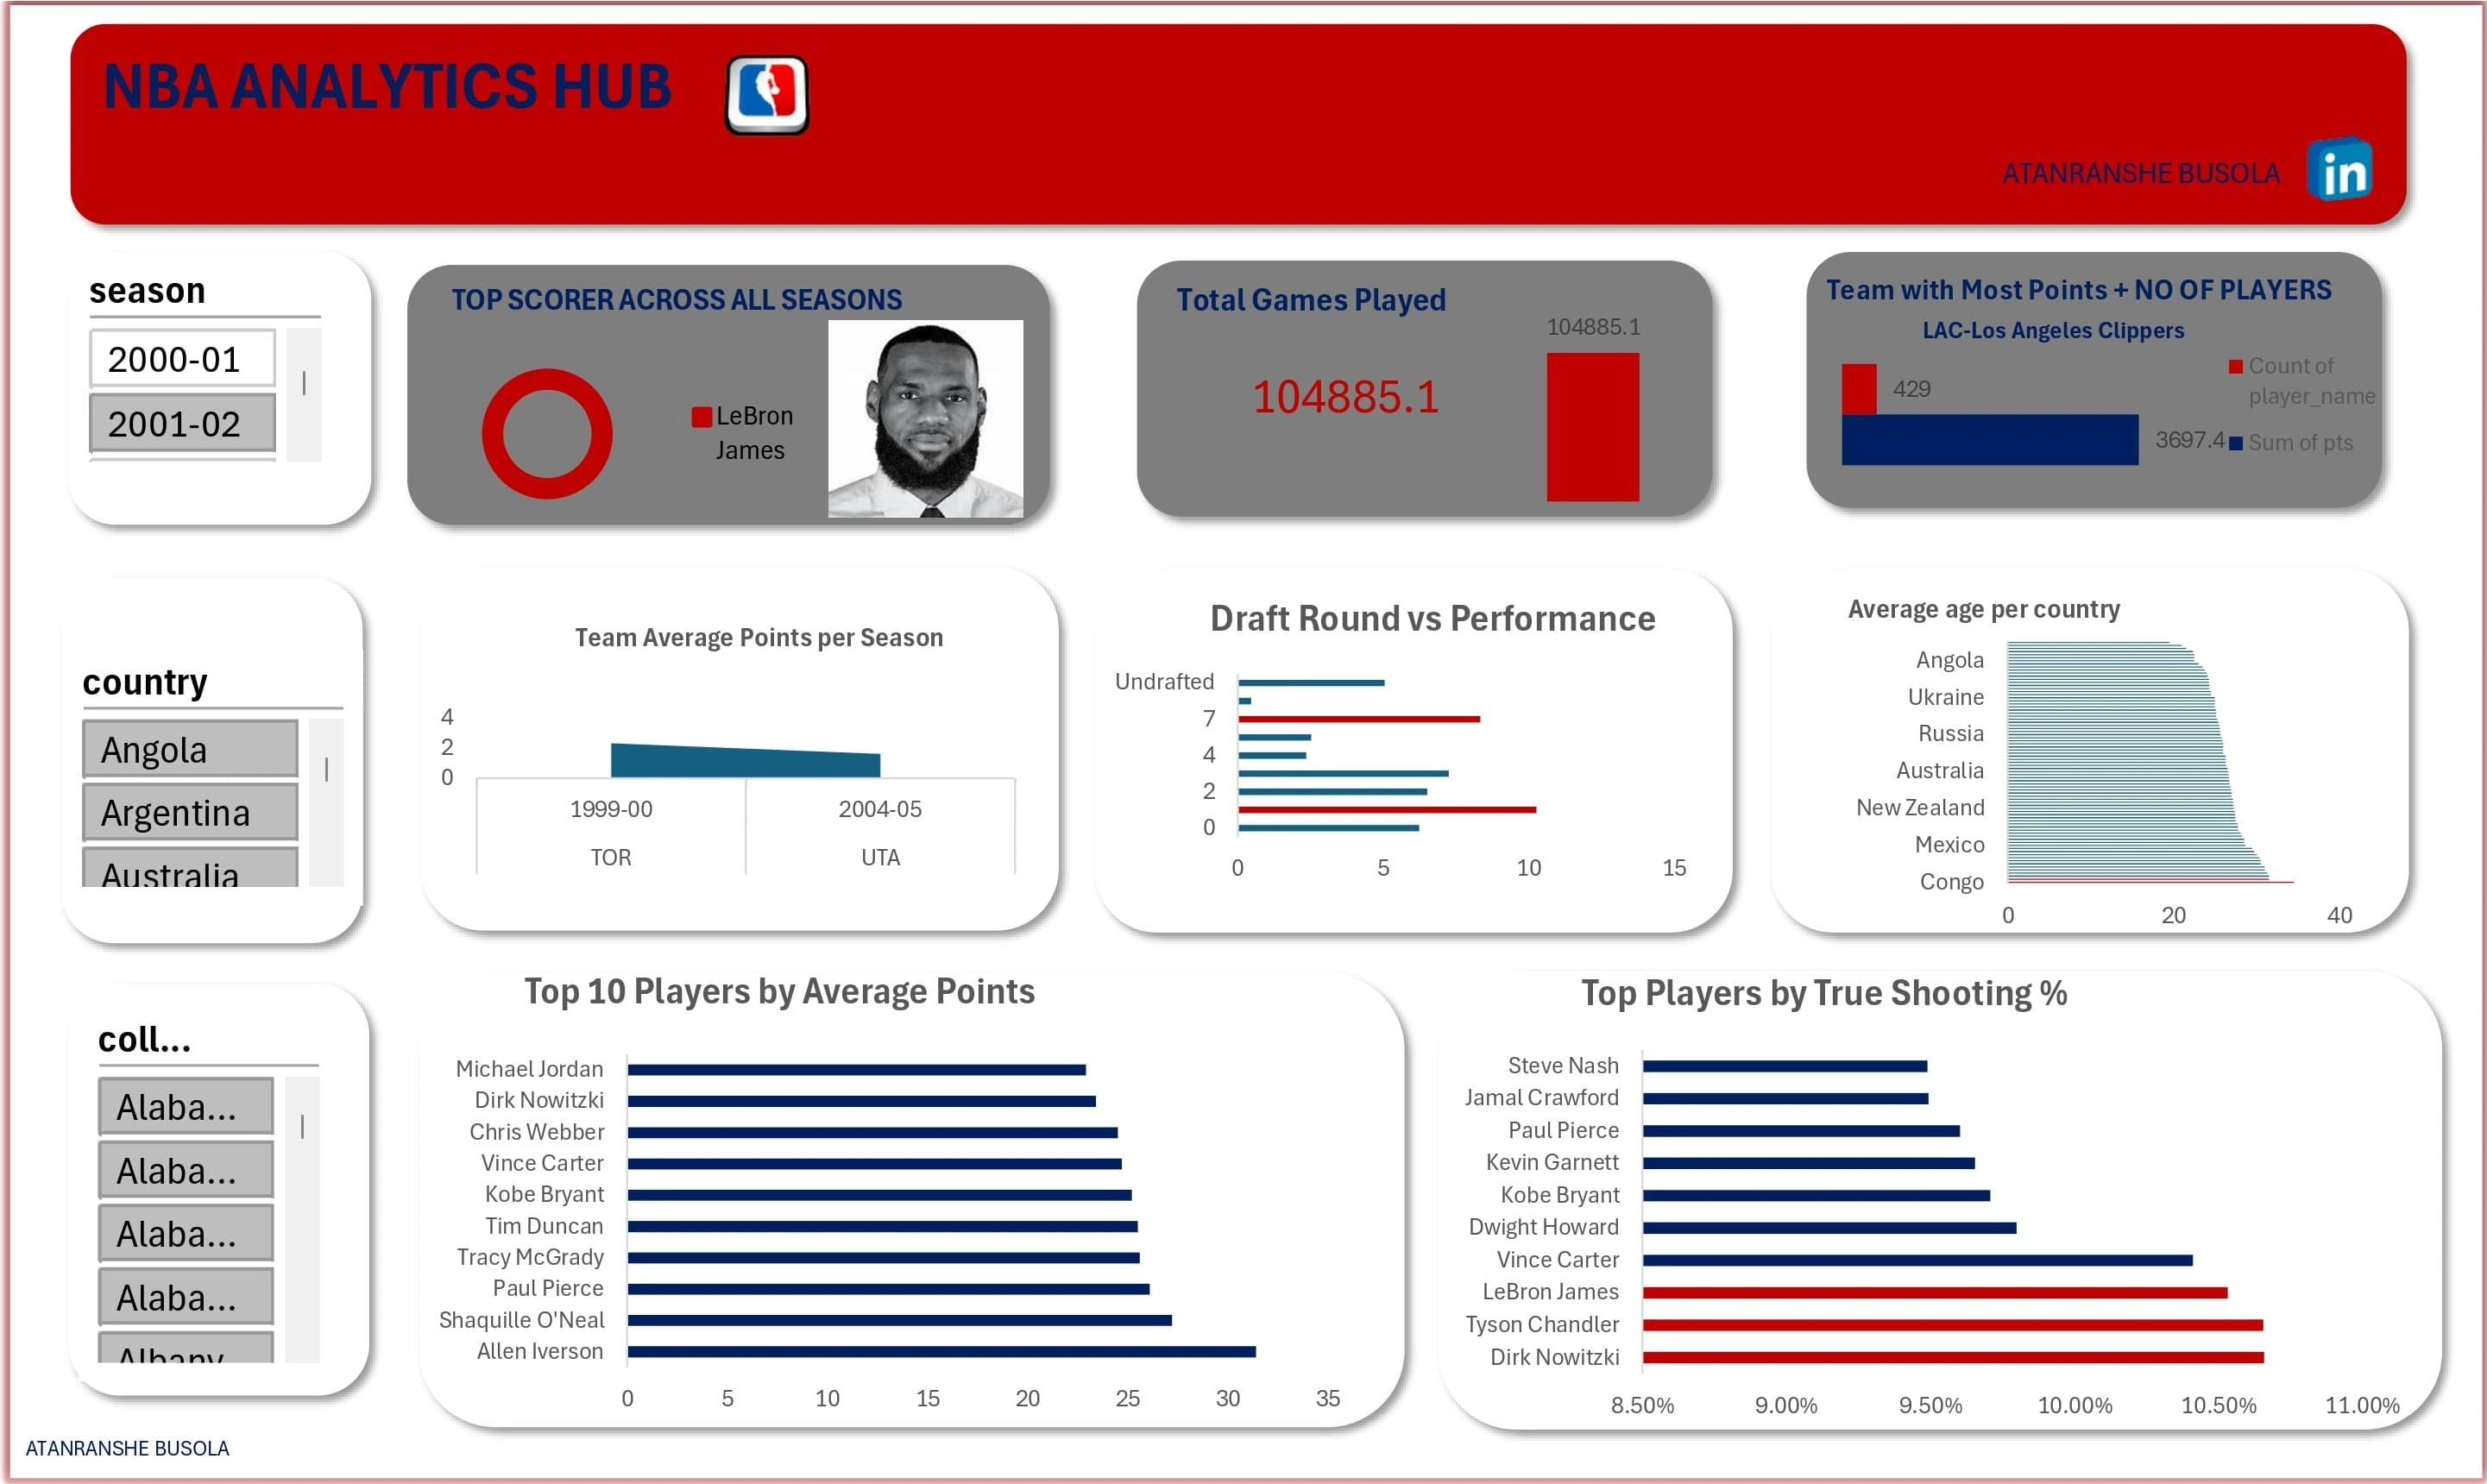
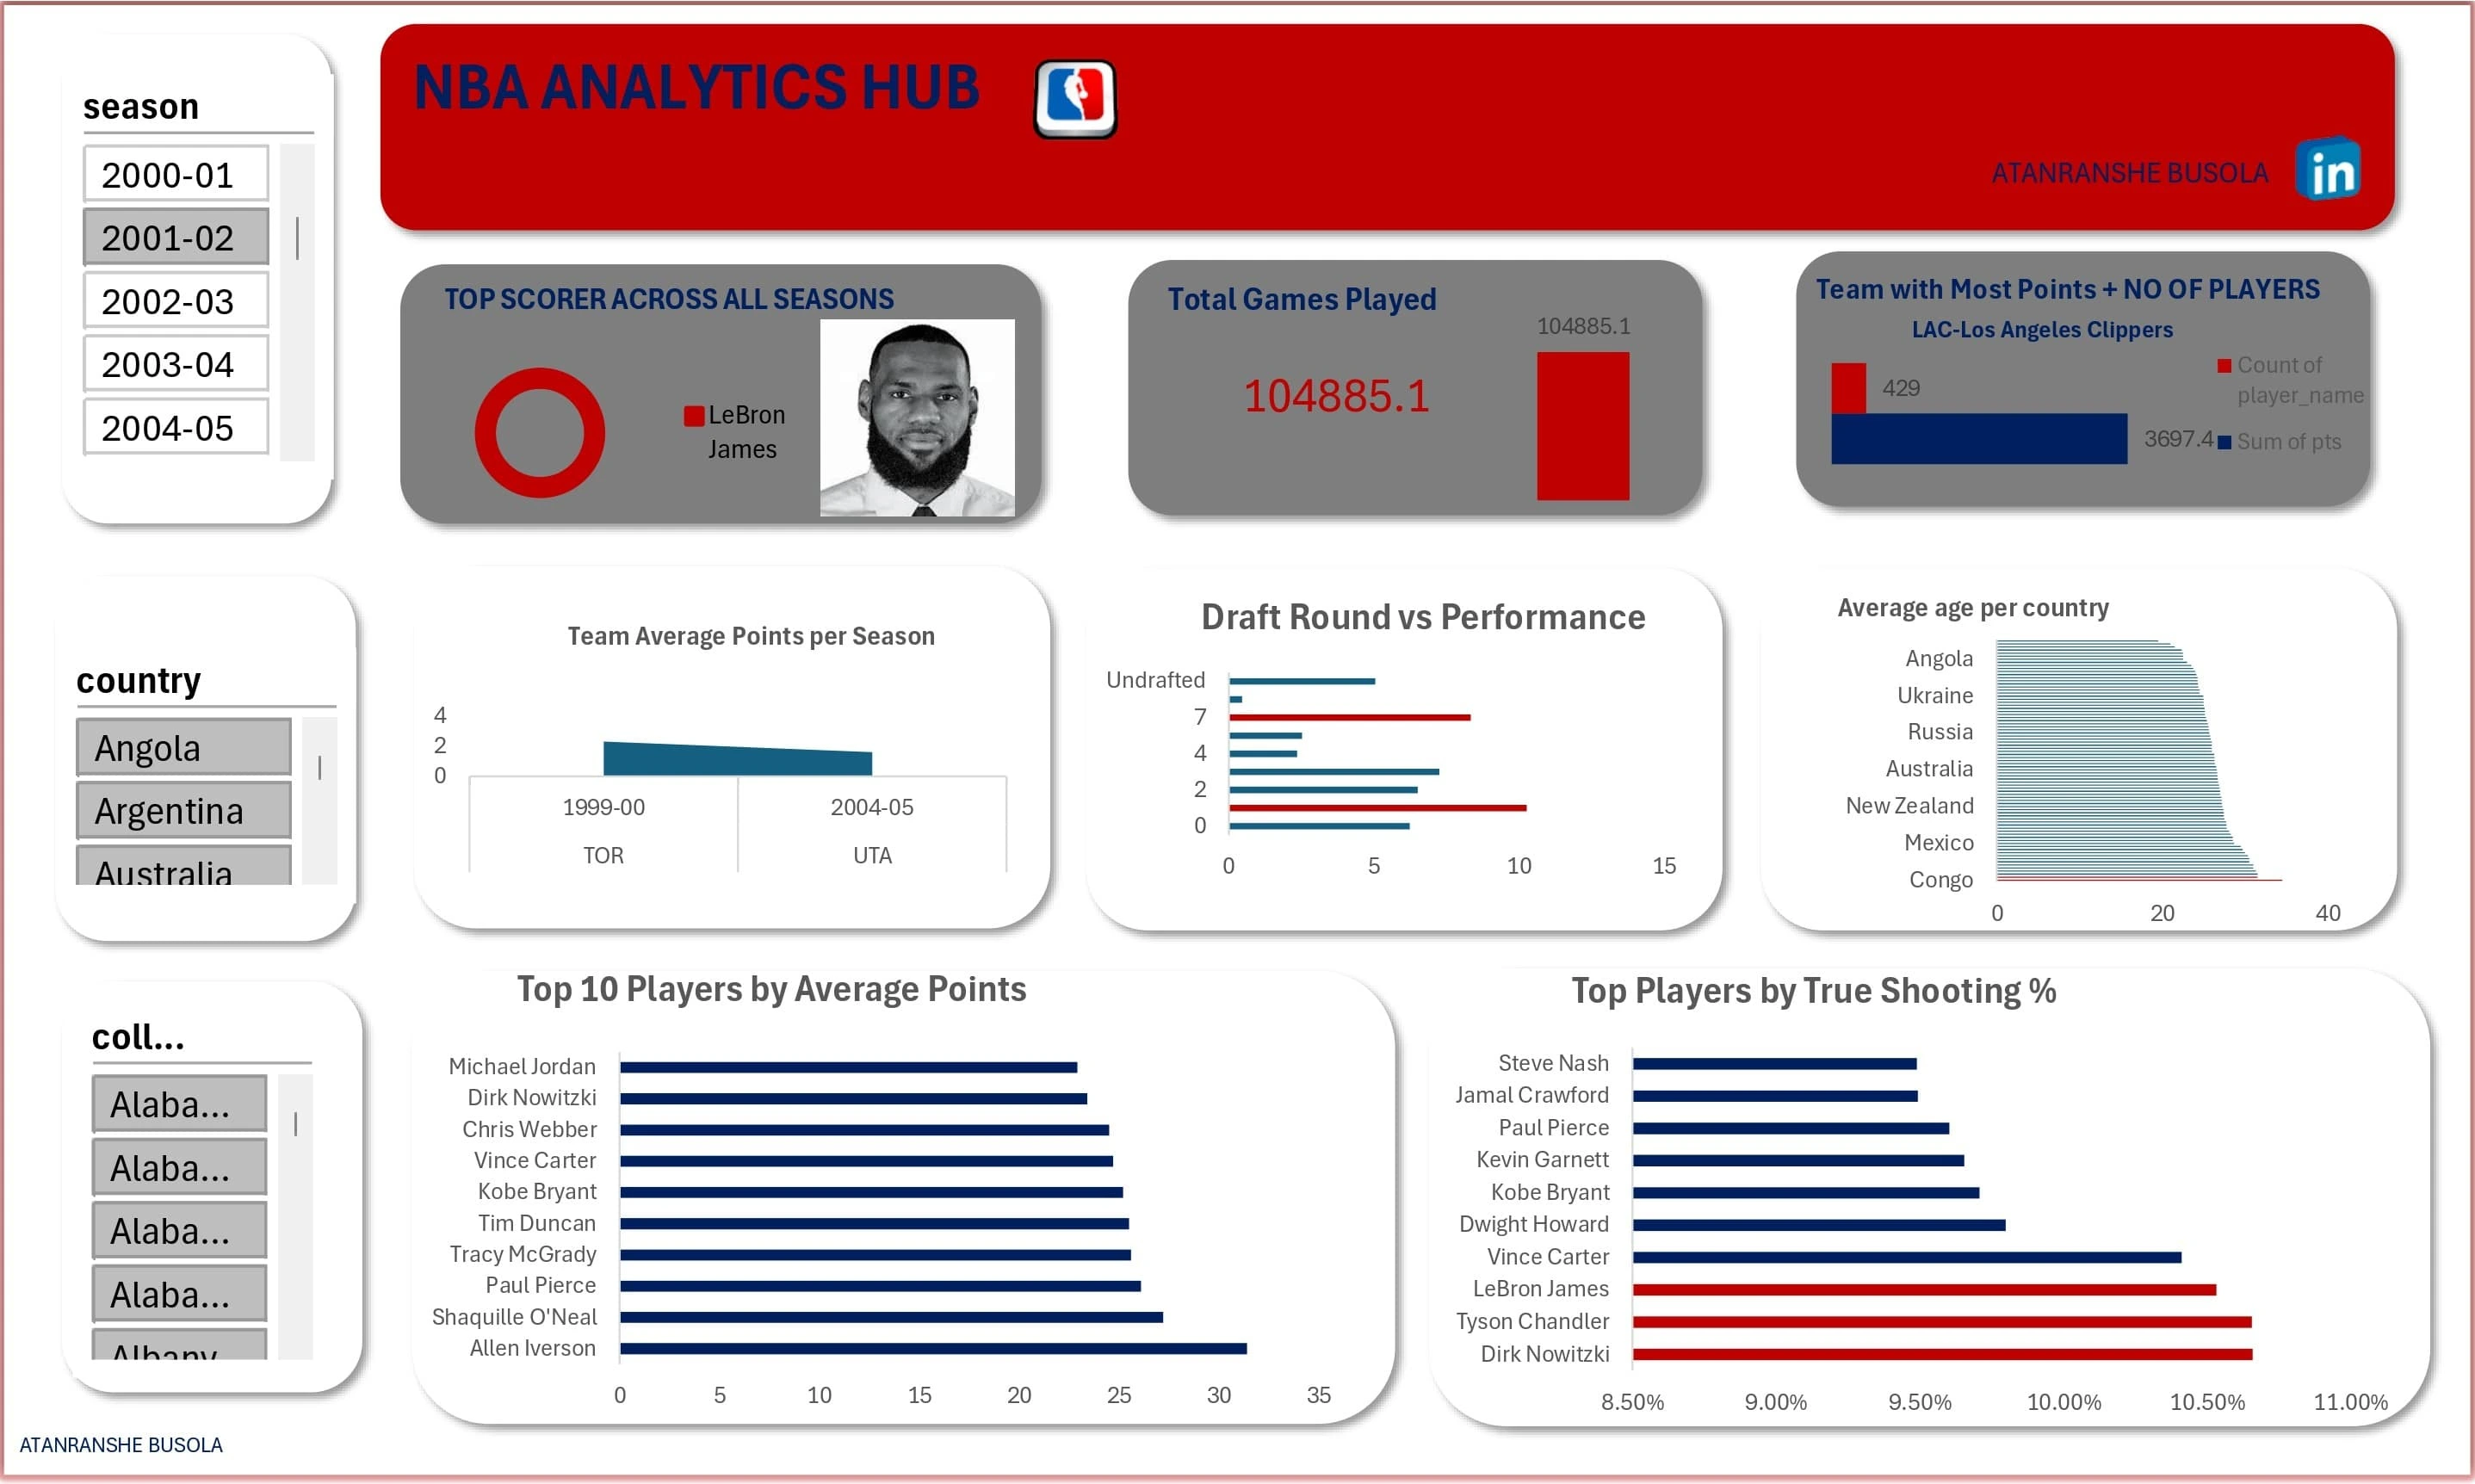
NBA Dashboard: Top Scorers & Performance Trends Using Microsoft Excel
This project involved designing an NBA dashboard using Microsoft Excel, focusing on top scorers and performance trends across multiple seasons. The dashboard allows users to track player performance, analyze trends, and gain insights into scoring patterns and key metrics such as points per game (PPG), assists, rebounds, and shooting accuracy.
The goal of the project was to create an interactive, visually appealing dashboard that could be easily used by basketball enthusiasts, analysts, or teams to track the top scorers in the NBA while highlighting key performance indicators (KPIs) and trends.
Key Features:
Top Scorers Analysis:
Top Players by Season: Tracks the top NBA scorers across different seasons, allowing users to compare scoring trends year over year.
Scoring Breakdown: Displays key stats such as points per game (PPG), field goal percentage, and total points for each player.
Performance Trends:
Seasonal Comparison: Compares players' performances across multiple seasons to identify trends, including improvement or decline in scoring performance.
Player Efficiency Metrics: Analyzes players’ overall efficiency, using stats like Player Efficiency Rating (PER), assists, and rebounds.
Interactive Dashboard:
Dynamic Filters: Users can filter data by season, team, or player, making it easier to focus on specific performance trends.
Data Visualization: Uses visually appealing charts and graphs, such as bar charts, line graphs, and heat maps, to display scoring trends and performance comparisons.
Detailed Metrics & Insights:
Top Performers: Highlights the top 10 players each season, along with key statistics and player efficiency.
Scoring Trends: Visualizes scoring trends throughout the season, including peaks and dips in performance for key players.
Seasonal Insights: Provides insights into which players consistently perform well and how trends evolve over the course of the season.
KPI Tracking:
KPI Dashboard: Tracks performance metrics, such as scoring averages, assists, rebounds, and shooting accuracy, providing a comprehensive view of player performance over time.
Data Analysis: Allows users to conduct deeper analyses on factors such as team dynamics, scoring distribution, and individual player progress.
Additional Features:
Custom Excel Functions: Utilizes advanced Excel functions such as VLOOKUP, SUMIFS, and pivot tables to dynamically update the dashboard with new data.
Data Import: Capable of importing updated NBA statistics directly, allowing for ongoing updates and data accuracy.
Conditional Formatting: Highlights high performers and low performers using conditional formatting, making it easy to spot trends and standout players.
User Engagement:
The dashboard provides an engaging experience for fans, analysts, or coaches by presenting NBA data in a clear, understandable format, emphasizing important metrics and trends that can drive performance discussions.
Call to Action (CTA):
Interested in exploring more complex basketball statistics or need custom performance tracking? Contact me to create a customized NBA dashboard tailored to your specific needs!
Like this project
Posted Apr 6, 2025
The NBA dashboard displays top player performance, team stats, and key metrics, showcasing player achievements, team rankings, and KPIs across multiple seasons.
Likes
4
Views
69
Timeline
Apr 5, 2025 - Apr 6, 2025