Serial Killers Dashboard
Atanranshe Oluwabusola
Serial Killers Rate per Country: A Global Analysis of Serial Killers
This project focuses on analyzing the rate of serial killings across different countries, offering a comparative overview of serial killer activity worldwide. Using data analysis and visualization tools, I created a dashboard that tracks the rate of serial killings per country, helping users identify regions with higher occurrences and patterns of serial killer activity.
The dashboard is designed to provide a data-driven approach to understanding global trends in serial killings, taking into account factors like population size, crime reporting, and cultural factors. It allows for a deep dive into historical trends, geographical hotspots, and country-specific crime data, making it a valuable tool for researchers, criminologists, and anyone interested in the study of serial crime patterns.
Key Features:
Global Serial Killer Rate Analysis:
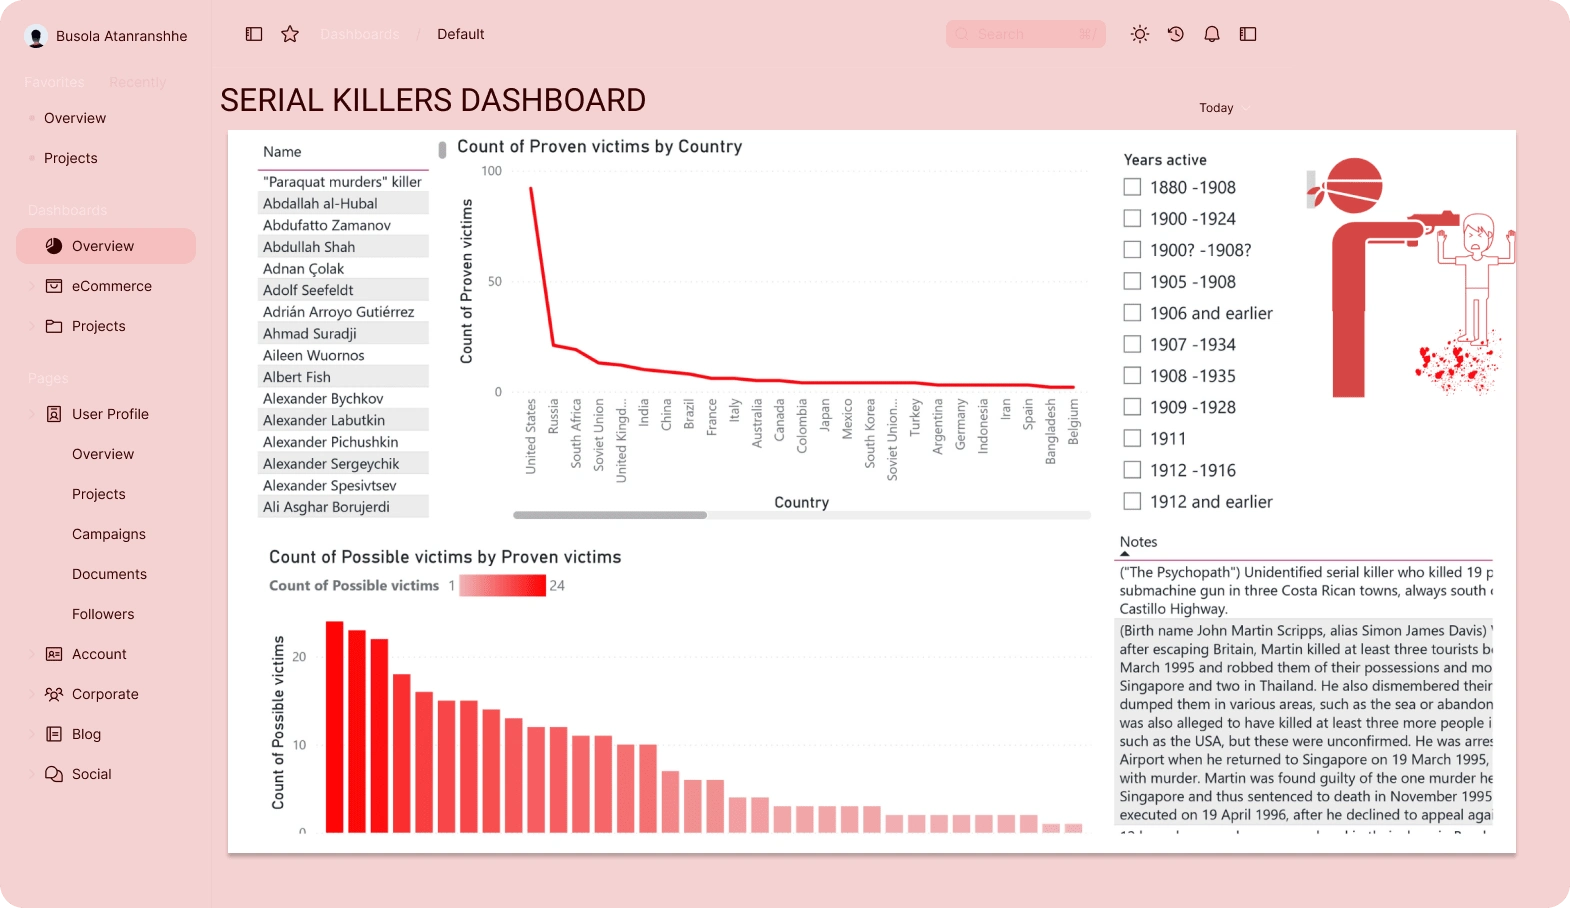
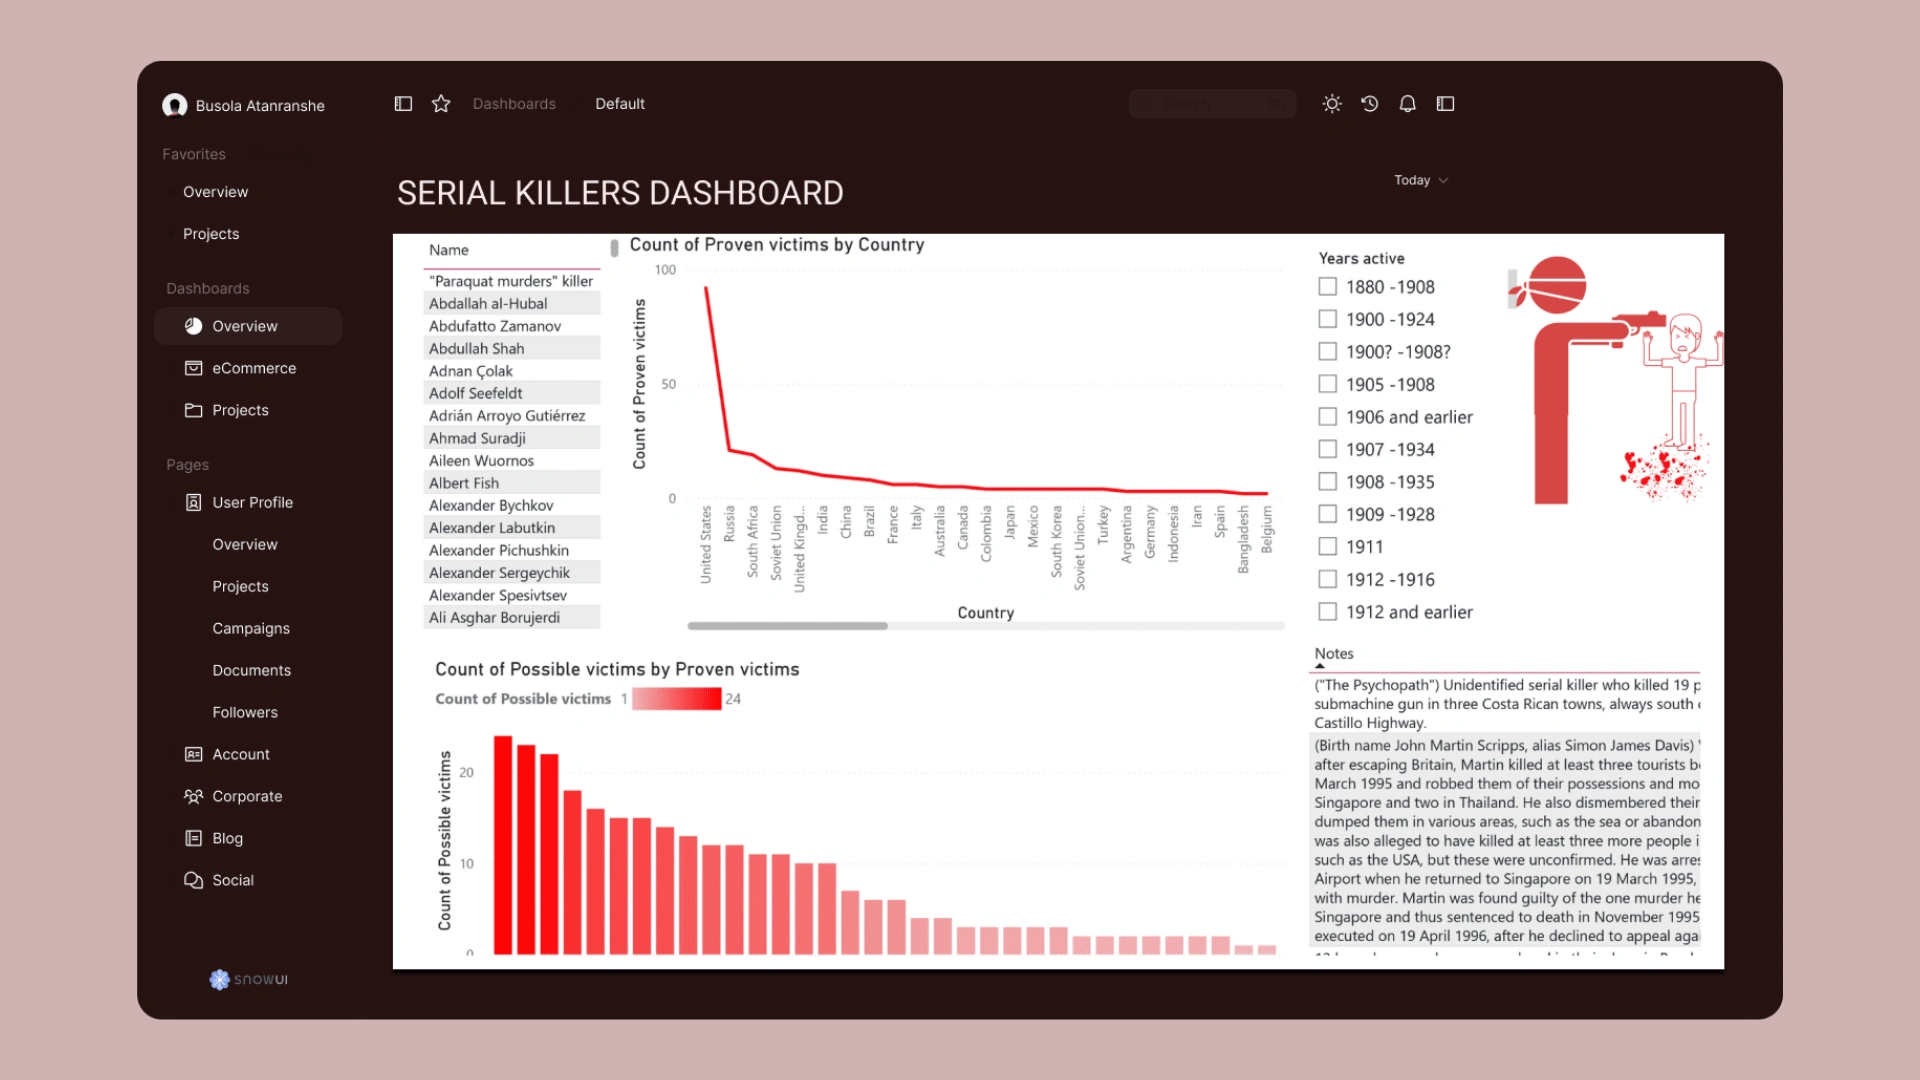
Rate per Country: Displays the rate of serial killings per country, showing the number of serial killings relative to the population size, giving an accurate comparison across different nations.
Serial Killers per Capita: Visualizes the number of serial killers in each country as a per capita figure, providing insights into countries with disproportionate serial killer activity.
Crime Rate vs. Serial Killer Rate: Compares general crime rates with serial killer rates, helping to distinguish countries with higher or lower serial killer occurrences compared to their overall crime rate.
Geographical Hotspots:
Heat Map: Features a heat map that highlights countries with the highest concentration of serial killings, offering a visual representation of global serial killer activity.
Region-Specific Analysis: Breaks down serial killer rates by region (e.g., North America, Europe, Africa) to identify regional trends and anomalies.
Historical Trends & Timeline:
Time Series Analysis: Tracks the number of serial killings over time, highlighting peaks and lulls in activity to uncover historical trends.
Decade-by-Decade Breakdown: Breaks down serial killer activity by decade to show how trends have evolved over time, with insights into increasing or decreasing rates in different countries.
Criminal Profile Insights:
Age and Gender Data: Tracks serial killer profiles, categorizing killers by age, gender, and methodology, providing deeper insights into common traits among serial killers in different regions.
Motive Analysis: Analyzes common motives for serial killings by country, allowing users to explore the underlying factors driving criminal behavior across different cultures and societies.
Interactive Data Visualization:
Dynamic Filters: Allows users to filter data by country, time period, or serial killer characteristics, enabling detailed exploration of specific trends.
Charts and Graphs: Utilizes bar charts, line graphs, and scatter plots to present serial killer data in an easy-to-read format, enabling clear comparisons across countries.
Ranking List: Shows a ranked list of countries with the highest serial killer rates, allowing users to quickly identify the top offenders.
Additional Features:
Detailed Country Profiles: Provides in-depth profiles for each country, including key statistics on serial killers, victim data, and crackdowns.
Law Enforcement and Reporting Insights: Includes data on law enforcement activity, crime reporting standards, and investigations that may affect the accuracy of serial killer data in different countries.
Comparative Data Analysis: Allows users to compare multiple countries side-by-side to identify patterns, trends, and outliers in serial killer data.

User Engagement:
This Serial Killers Rate per Country Dashboard is a powerful tool for researchers, criminologists, journalists, and anyone interested in crime data analysis. It allows users to understand the global landscape of serial killings, identify geographical trends, and explore historical patterns of serial killer activity.
Like this project
Posted Mar 8, 2025
Tracks proven and possible victims, along with key details for deeper insights into patterns and trends. Engaging visual.
Likes
1
Views
20
Timeline
Jan 14, 2025 - Jan 17, 2025
Clients
Personal Project