🎧 From Streams to Stories: A Spotify Dashboard Experience
Atanranshe Oluwabusola
Spotify Dashboard: Visualizing My Top Artists & Most Played Songs
Project Description:
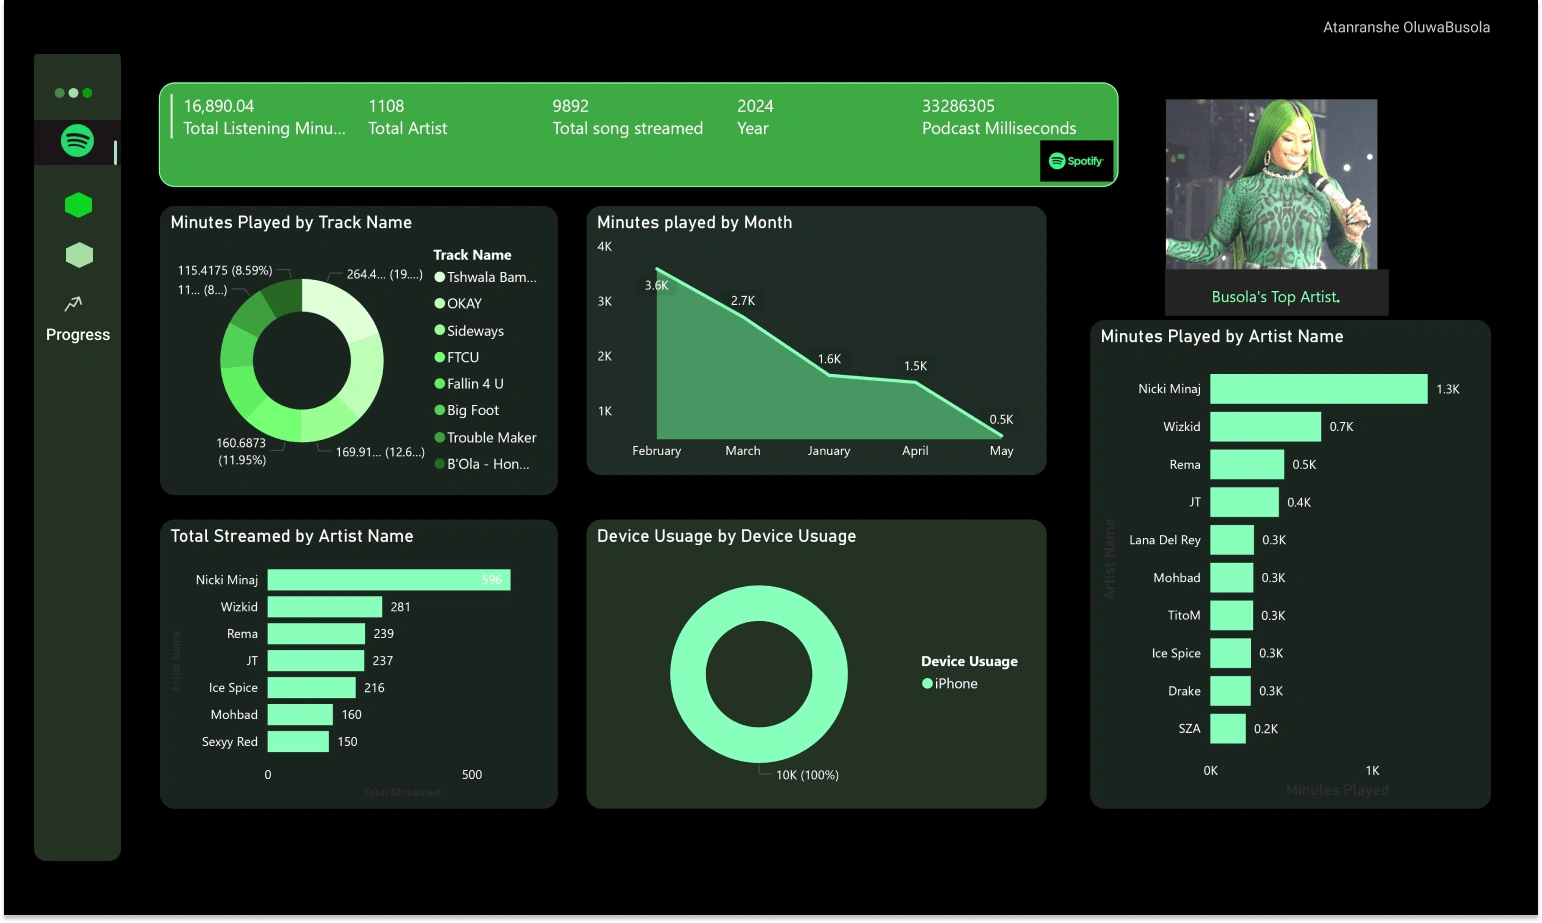
This Spotify Dashboard is a personalized, interactive visualization tool that highlights my most listened-to artist and most played song, giving me an insightful overview of my listening habits. Designed using Microsoft Excel (or Power BI if applicable), it offers a clear, engaging presentation of my music preferences and trends over time.
The dashboard pulls data from my Spotify account, focusing on key metrics such as the top artist, top song, play counts, and listening frequency. The interactive design allows for easy navigation between different data points and helps me track shifts in my listening behavior. Whether I’m reflecting on my music taste, sharing my favorite artists, or simply exploring my musical journey, this dashboard offers a streamlined way to visualize my top listening trends.
Key Features:
Top Artist & Song Overview:
Most Listened-to Artist: Displays the artist I listen to the most, including the total number of plays and any associated details, such as their genre or country of origin.
Most Played Song: Highlights my most frequently played song, providing insights into my all-time favorites based on play counts.
Time-based Play Data: Allows me to see which songs or artists I listen to the most during specific time periods (daily, weekly, or monthly).
Play Frequency:
Play Count Breakdown: Visualizes the number of times I’ve played specific tracks and albums, helping me understand which songs and artists dominate my playlists.
Listening Habits Over Time: Tracks my listening behavior across different periods, so I can analyze how my tastes change over time and identify seasonal preferences.
Top Genres & Playlists:
Most Played Genres: Displays the genres I listen to the most, offering insights into the diversity or specialization of my musical taste.
Favorite Playlists: Shows the playlists I’ve interacted with most frequently, helping me track my curated collections and explore new music within these playlists.
Data Visualizations:
Bar Charts: Highlights the most played songs and artists in a bar chart format, making it easy to compare multiple data points.
Pie Charts: Provides a visual breakdown of my music preferences, such as my favorite genres, top artists, and the percentage of plays across various categories.
Trend Lines: Tracks my listening habits over time, showing how my music preferences evolve.
Engaging Interactivity:
Dynamic Filters: Lets me filter the data by artist, song, or time period for deeper analysis of my listening trends.
Hover and Tooltip Features: Provides additional information on specific data points when I hover over charts or graphs, enhancing the interactive experience.
Additional Features:
Music Insights: Gives detailed music insights, such as the average play count per song or number of days I’ve listened to a particular artist.
Sharing Options: Allows me to share the dashboard with others, whether on social media or within a personal group, letting friends or followers see my top songs and artists.
Comparison Feature: Offers the ability to compare my top artists or songs with my listening habits from previous months or years, allowing me to track how my preferences shift over time.

User Engagement:
This Spotify Dashboard is an ideal tool for music enthusiasts like myself who want to take a deeper dive into their listening habits. It's not just a visual representation of my music data, but also an engaging, interactive experience that allows me to reflect on my evolving musical taste.
Call to Action (CTA):
Want to visualize your own Spotify listening data? Contact me to create a personalized music dashboard that gives you insights into your top artists, songs, and listening trends!
Like this project
Posted Mar 8, 2025
This dashboard transforms raw Spotify data into powerful insights about listener behavior, top-performing tracks,
Likes
1
Views
35
Timeline
Jan 8, 2025 - Jan 10, 2025
Clients
Personal Project