TESLA EV INSIGHT
Atanranshe Oluwabusola
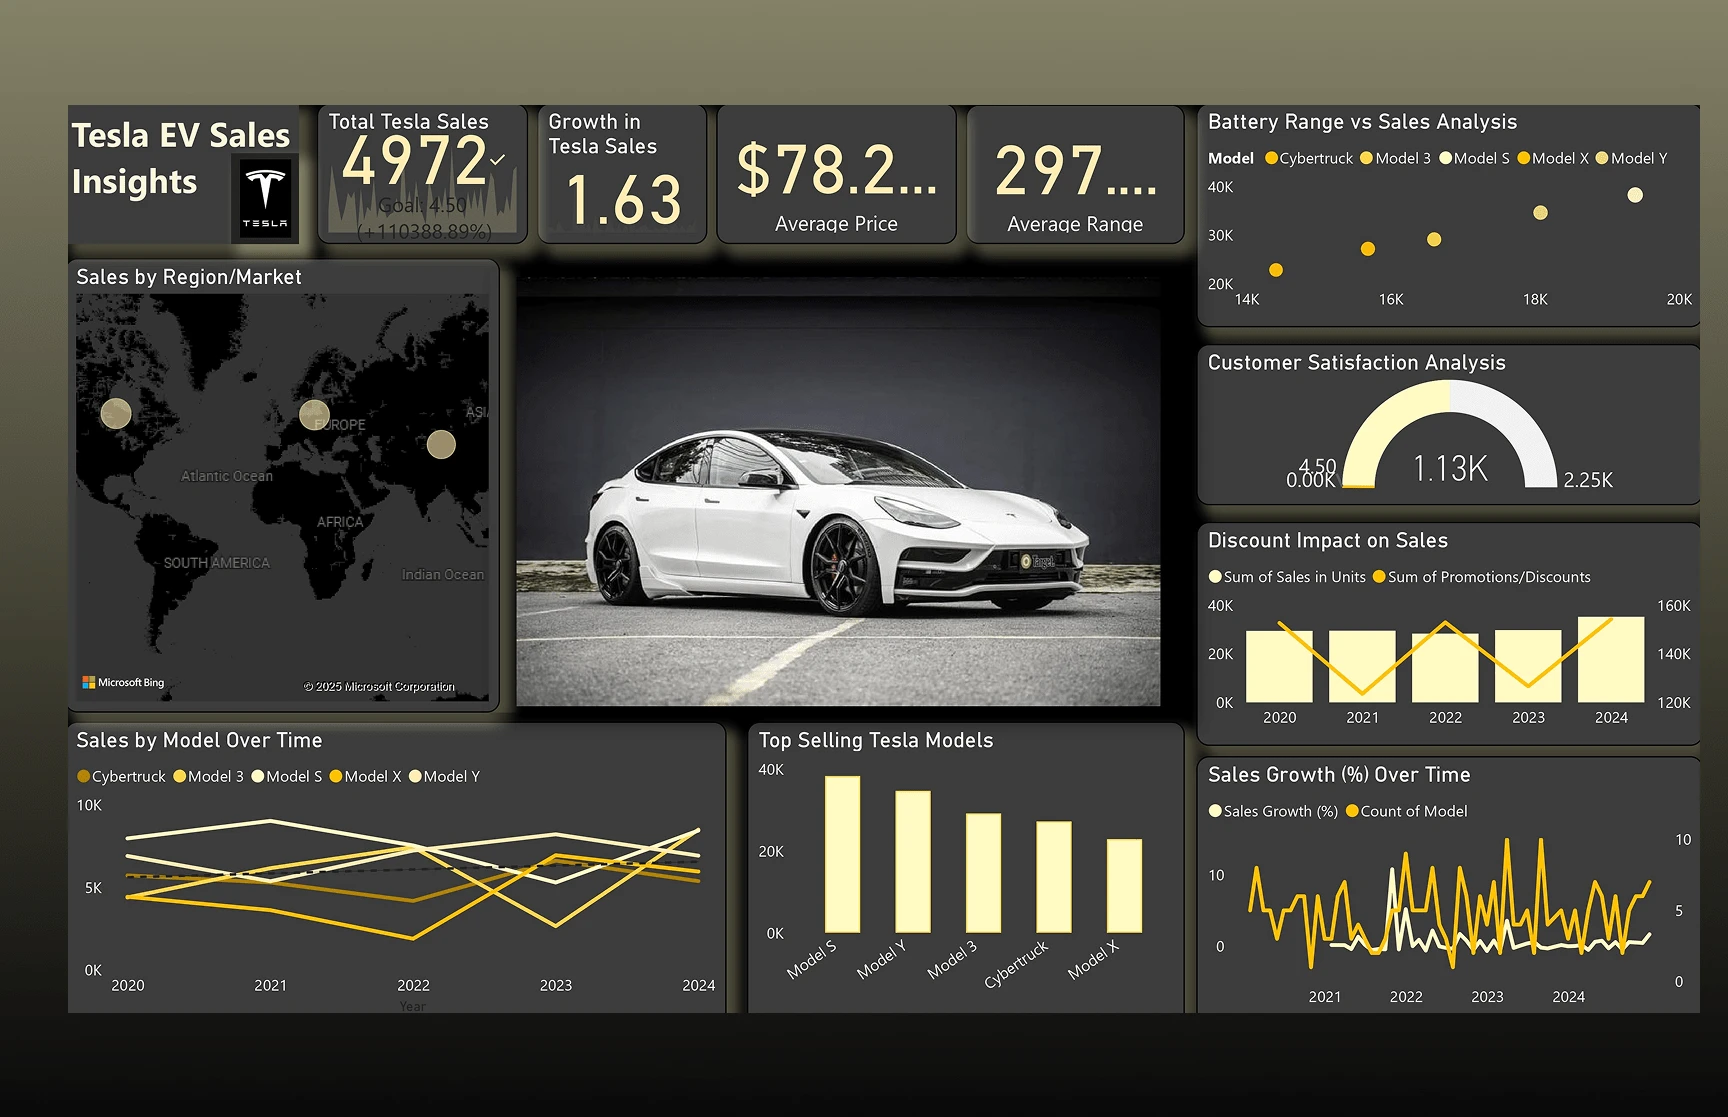
TESLA EV SALES INSIGHT.
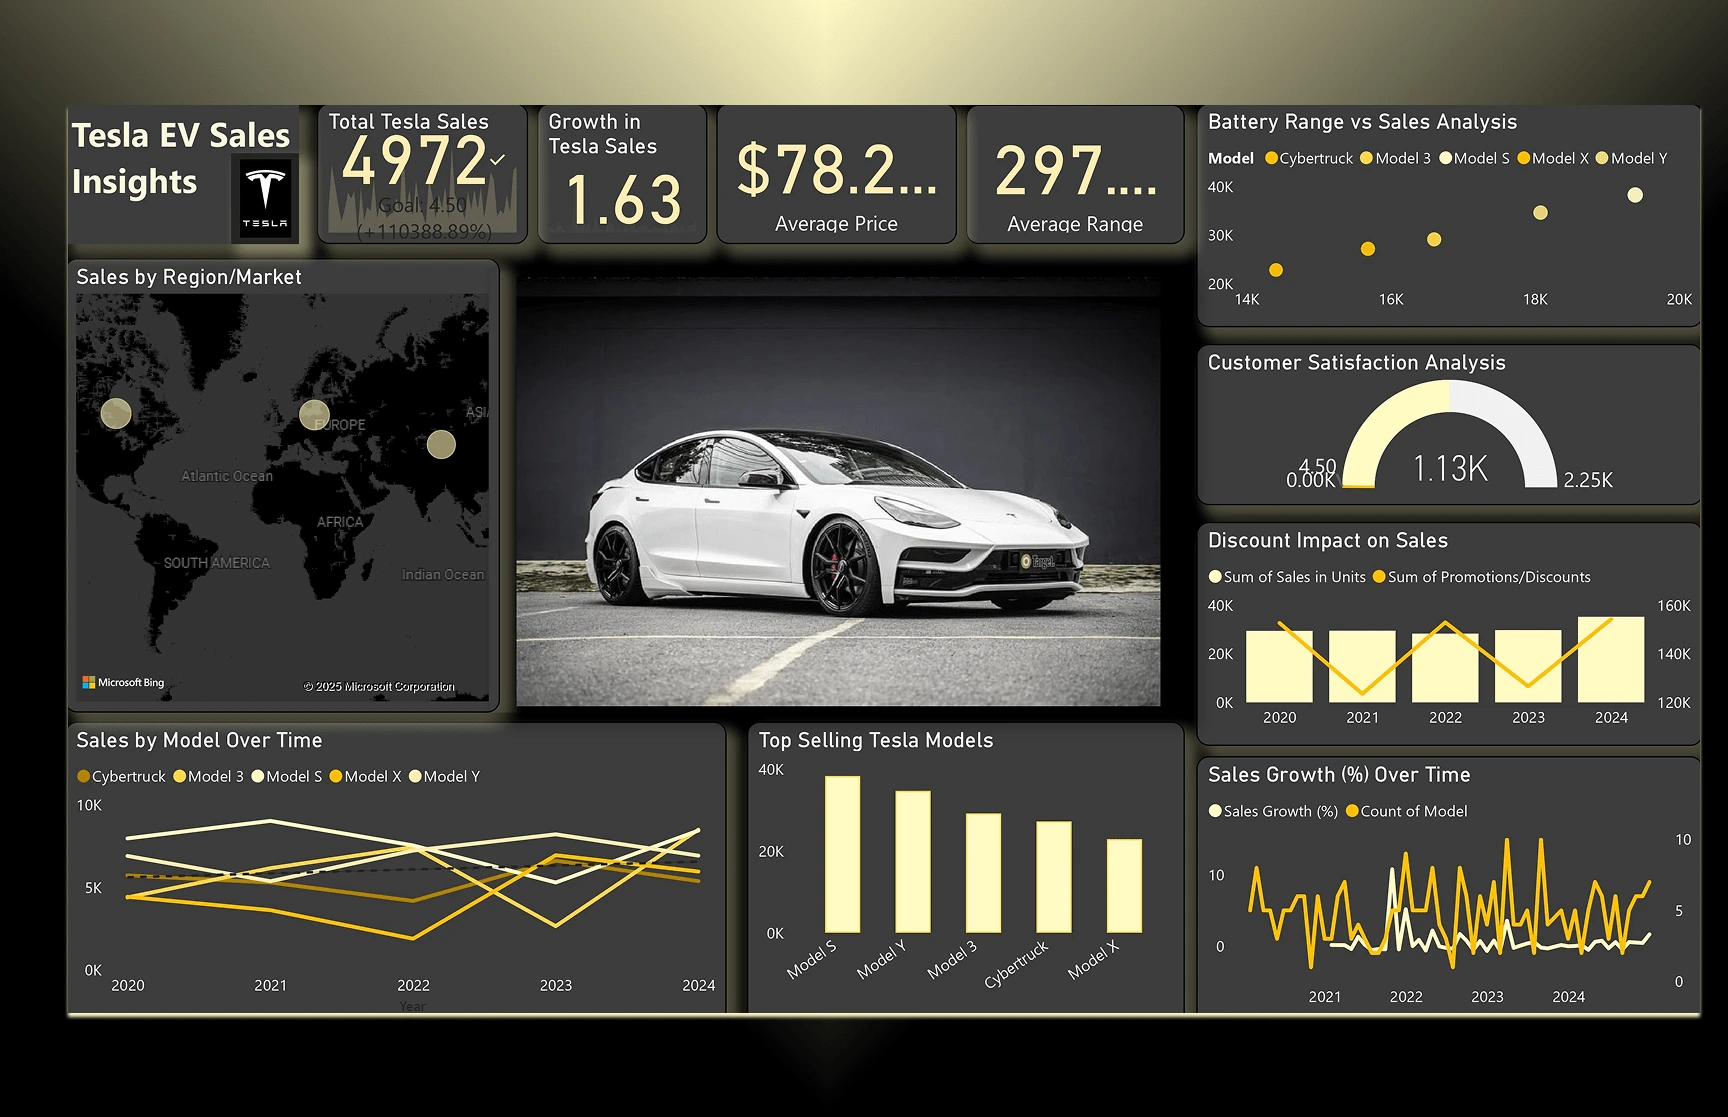
This project focuses on creating an in-depth Tesla EV sales dashboard designed to analyze and visualize the performance of Tesla’s electric vehicle (EV) sales. The dashboard provides insights into individual model sales, overall sales trends, and key metrics such as electric range, average sales per region, and year-over-year growth. By using Microsoft Excel or Power BI, I built a comprehensive tool that enables users to explore Tesla's EV performance over time and across various markets.
The dashboard is aimed at stakeholders who need to make informed decisions based on sales data, market trends, and model performance, helping them understand which Tesla models are performing best and where growth opportunities exist.
Key Features:
Model Sales Analysis:
Sales Breakdown by Model: Tracks the sales of each Tesla model (e.g., Model S, Model 3, Model X, and Model Y) to identify which vehicles are performing the best in terms of volume.
Total Sales: Displays total sales figures for each model and provides a comparison of how each model is performing relative to others.
Electric Range: Visualizes the electric range for each model, providing insights into which models offer the best performance in terms of range per charge.
Market & Regional Insights:
Regional Sales Data: Allows users to filter sales performance by region, helping identify top-performing markets for Tesla’s EVs.
Sales Growth by Region: Analyzes year-over-year growth for each region, giving users insight into Tesla’s expanding market presence.
Trends & Performance Metrics:
Sales Trends: Uses line graphs to track sales trends over time, making it easy to spot any seasonal fluctuations or overall growth.
Key Performance Indicators (KPIs): Tracks critical sales KPIs such as units sold, average sales per quarter, sales growth rate, and market share.
Model-Specific Insights: Delves into the performance of individual models by analyzing average price, customer demographics, and sales volume.
Interactive Data Visualization:
Dynamic Filters: Users can filter the data by year, region, or model to view specific sales insights for any given period.
Data Visualization Tools: Utilizes bar charts, pie charts, and line graphs to present Tesla sales data in an easily digestible format, enabling quick insights into sales performance.
Color-Coded Analysis: Conditional formatting is used to highlight the best-performing regions and models, allowing for quick identification of trends.
Custom Insights:
Electric Range vs. Sales Volume: Correlates electric range with sales volume to determine if range impacts the popularity of different models.
Sales Forecasting: Provides predictive insights based on historical data, offering a glimpse into future sales trends and potential areas for growth.
Additional Features:
Customizable Dashboards: The dashboard is highly customizable, allowing users to adjust filters and settings to track the metrics most important to them.
Integration with Excel & Power BI: This dashboard can be updated automatically through data imports into Excel or Power BI, ensuring that users have the most current insights at their fingertips.
KPI Tracking: Displays key metrics like sales growth percentage, regional market share, and model ranking to track the health of Tesla’s overall sales performance.
User Engagement:
The Tesla EV Sales Insight Dashboard empowers Tesla analysts, sales teams, investors, and enthusiasts to explore key trends and track model-specific performance. It provides a comprehensive view of Tesla’s EV market performance, enabling stakeholders to make data-driven decisions.
Call to Action (CTA):
Interested in creating your own custom Tesla EV dashboard or need deeper insights into electric vehicle sales? Contact me to get started on a tailored dashboard designed to fit your specific business or analytical needs.
Like this project
Posted Mar 22, 2025
This Tesla EV Sales Dashboard provides a deep overview of Tesla performance. It shows key insights such as total sales, top-selling model, sales growth trends.
Likes
3
Views
36
Timeline
Mar 20, 2025 - Mar 22, 2025
Clients
Personal Project