San Francisco Public Office Salaries Analysis
Osinachi Promise Luke
San Francisco Public Office Salaries Analysis
Table of Content
Project Overview
This analysis explores the salaries of public office employees in San Francisco from 2011 to 2014. The goal is to provide transparency for taxpayers and assess salary distribution, highest-paid employees, overtime trends, and the total compensation paid to public workers.
Business Introduction
Public office positions in San Francisco are known for their high standards and competitive salaries. Understanding salary distribution can help with workforce planning, budget allocation, and policy decisions.
Business Problem
The need for salary transparency and efficient resource allocation is critical for public service operations. This analysis seeks to answer key questions:
Who are the highest-paid employees?
What is the total amount paid to public officers?
How does overtime impact payroll?
Are there positions with high demand requiring additional staffing?
Project Objectives
Identify the highest-paid public officers.
Analyze salary distribution across different job titles.
Examine overtime trends and their impact on payroll.
Provide recommendations for optimizing workforce management.
Process
The dataset was obtained from Google Drive , ensuring reliable and structured data collection. https://docs.google.com/spreadsheets/d/1qkpgmB65IlORZKUb__OrJZmzeoeOdH6B/edit?usp=drive_link&ouid=104657862004776746607&rtpof=true&sd=true
The analysis involved:
Data Cleaning & Transformation – Handling missing values, formatting inconsistencies, and ensuring data accuracy.
Exploratory Data Analysis (EDA) – Examining salary patterns and workforce trends.
Data Visualization – Presenting insights using Power BI.
Tools Used
Power BI for cleaning, analysis and visualization
Insights
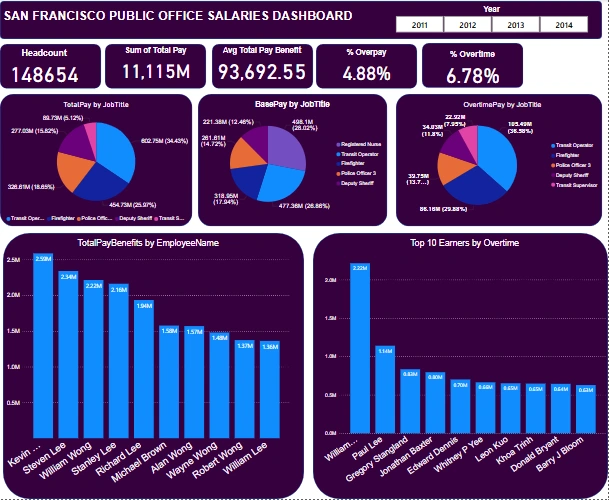
1. Workforce & Salary Overview
Total employees (headcount): 148,654
Total salary expenditure: $11M+
Average total pay benefit: $93,692.55
Overpay percentage: 4.88%
Overtime percentage: 6.78%
2. Top 5 Job Titles by Total Pay
Transit Operators: $602.75M (34.43%)
Firefighters: $454.73M (25.97%)
Police Officer 3: $326.61M (18.65%)
Deputy Sheriff
Transit Supervisor
These roles are high-paying due to their demanding nature and the number of employees in these positions.
3. Top 5 Job Titles by Base Pay
Registered Nurses: $498.1M (28.02%)
Transit Operators: $477.36M (26.86%)
Firefighters: $318.95M (17.94%)
Police Officer 3: 14.72%
Deputy Sheriff: 12.46%
4. Overtime Analysis
Transit Operators: $105.49M (36.58%)
Firefighters: $86.16M (29.88%)
Police Officers: $39.75M (13.78%)
Deputy Sheriff: $34.03M (11.8%)
Transit Supervisor: $22.92M (7.95%)
High overtime indicates staffing shortages or high job demands.
5. Highest Paid Employees by Total Pay
Kevin Lee (Deputy Court Clerk): $2.59M
Steven Lee (City Planning Intern): $2.34M
William Wong (Automotive Body & Fender Work): $2.22M
Stanley Lee: $2.16M
Richard Lee: $1.94M
6. Top Earners by Overtime
William Wong (Automotive Body & Fender Work): $2.22M
Paul Lee (Deputy Court Clerk III): $1.14M
Gregory Stangland (EMT/Paramedic/Firefighter): $833K
Jonathan Baxter (EMT/Paramedic/Firefighter): $795K
Edward Dennis: $700K
Recommendations
The high reliance on overtime, especially for critical roles such as Transit Operators, Firefighters, and Police Officers, suggests a need for additional staffing to reduce excessive workloads.
More investment in frontline services (e.g., emergency responders) may help improve efficiency and reduce burnout.
Salary transparency initiatives should continue to ensure public trust and effective payroll management.
Like this project
Posted Jun 3, 2025
Analyzed San Francisco public office salaries from 2011-2014 for transparency and resource allocation.
Likes
0
Views
2
Timeline
Jan 1, 2011 - Dec 31, 2014