Project title: Board Report Redesign:

Project title: Board Report Redesign: Q3 Performance Pack (Power BI)
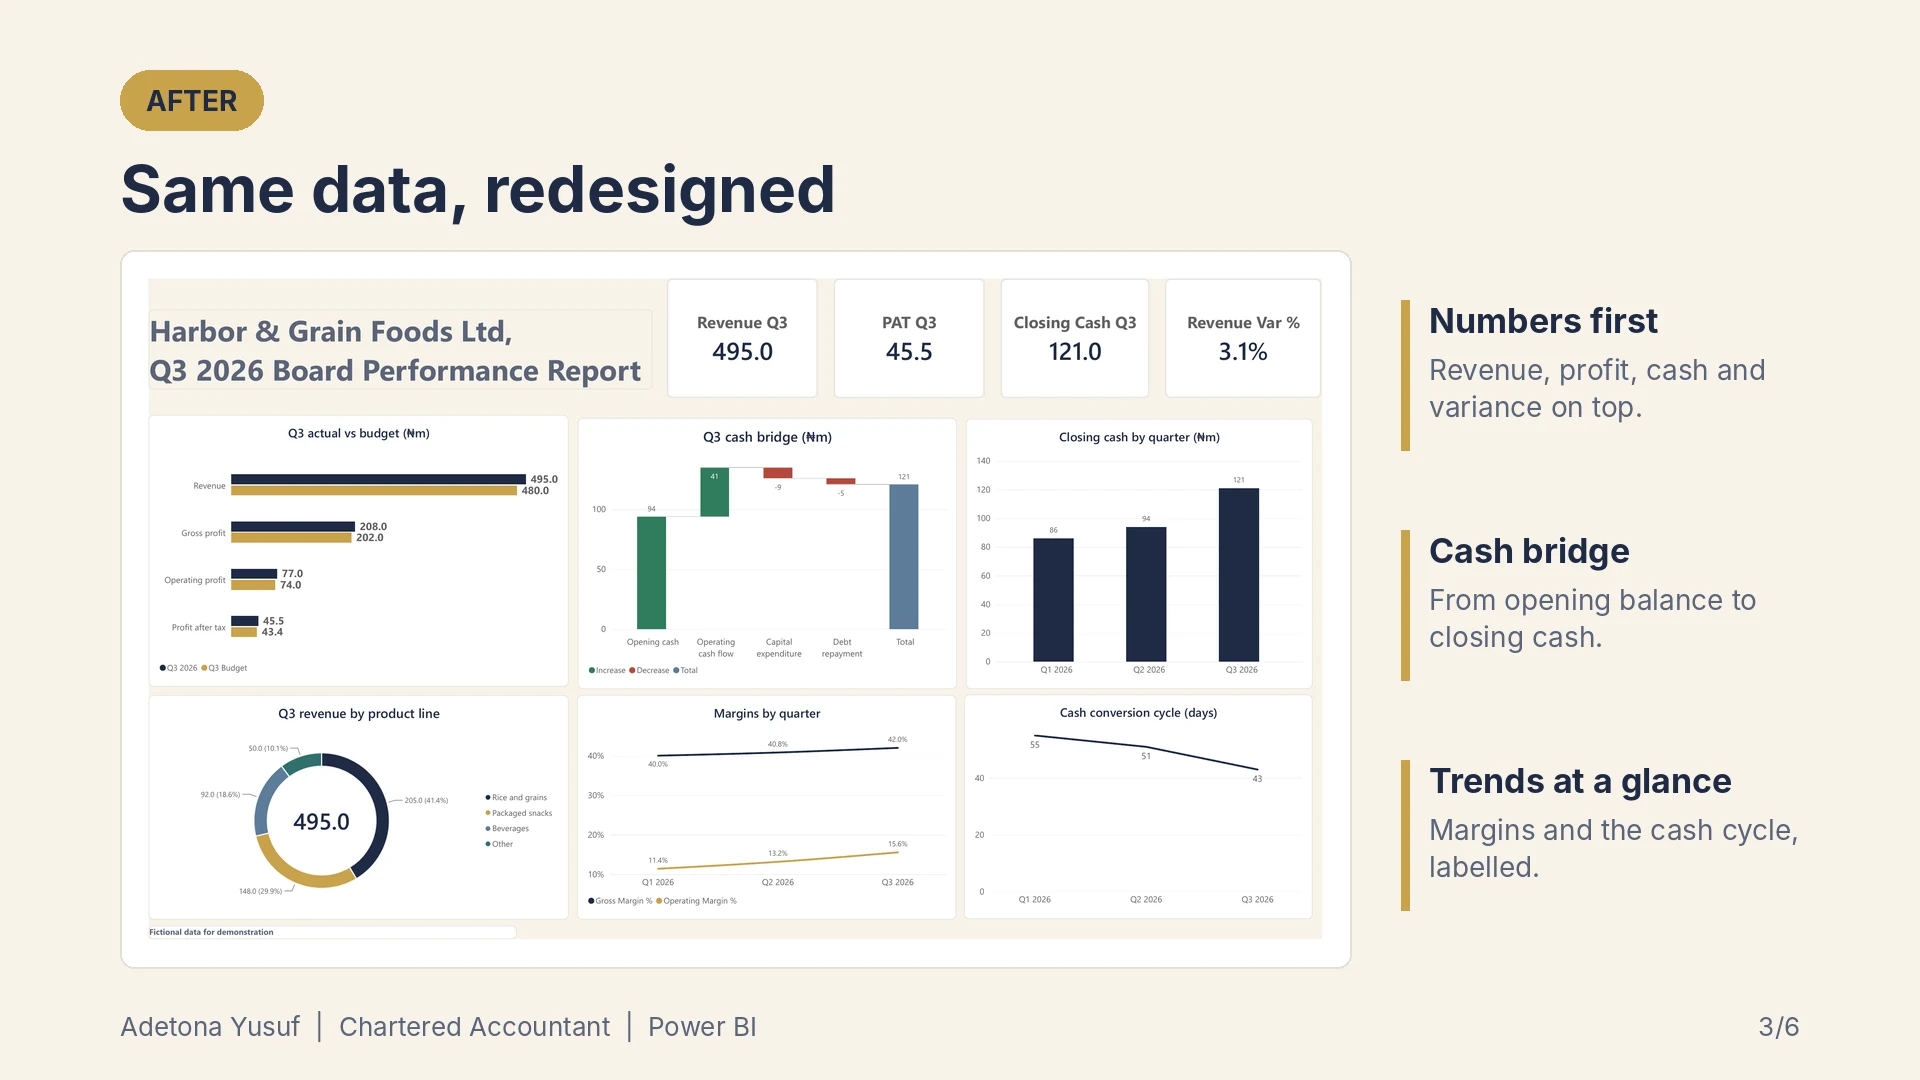
Same financial data, redesigned from a plain Word report into a one-page Power BI board view.
The problem
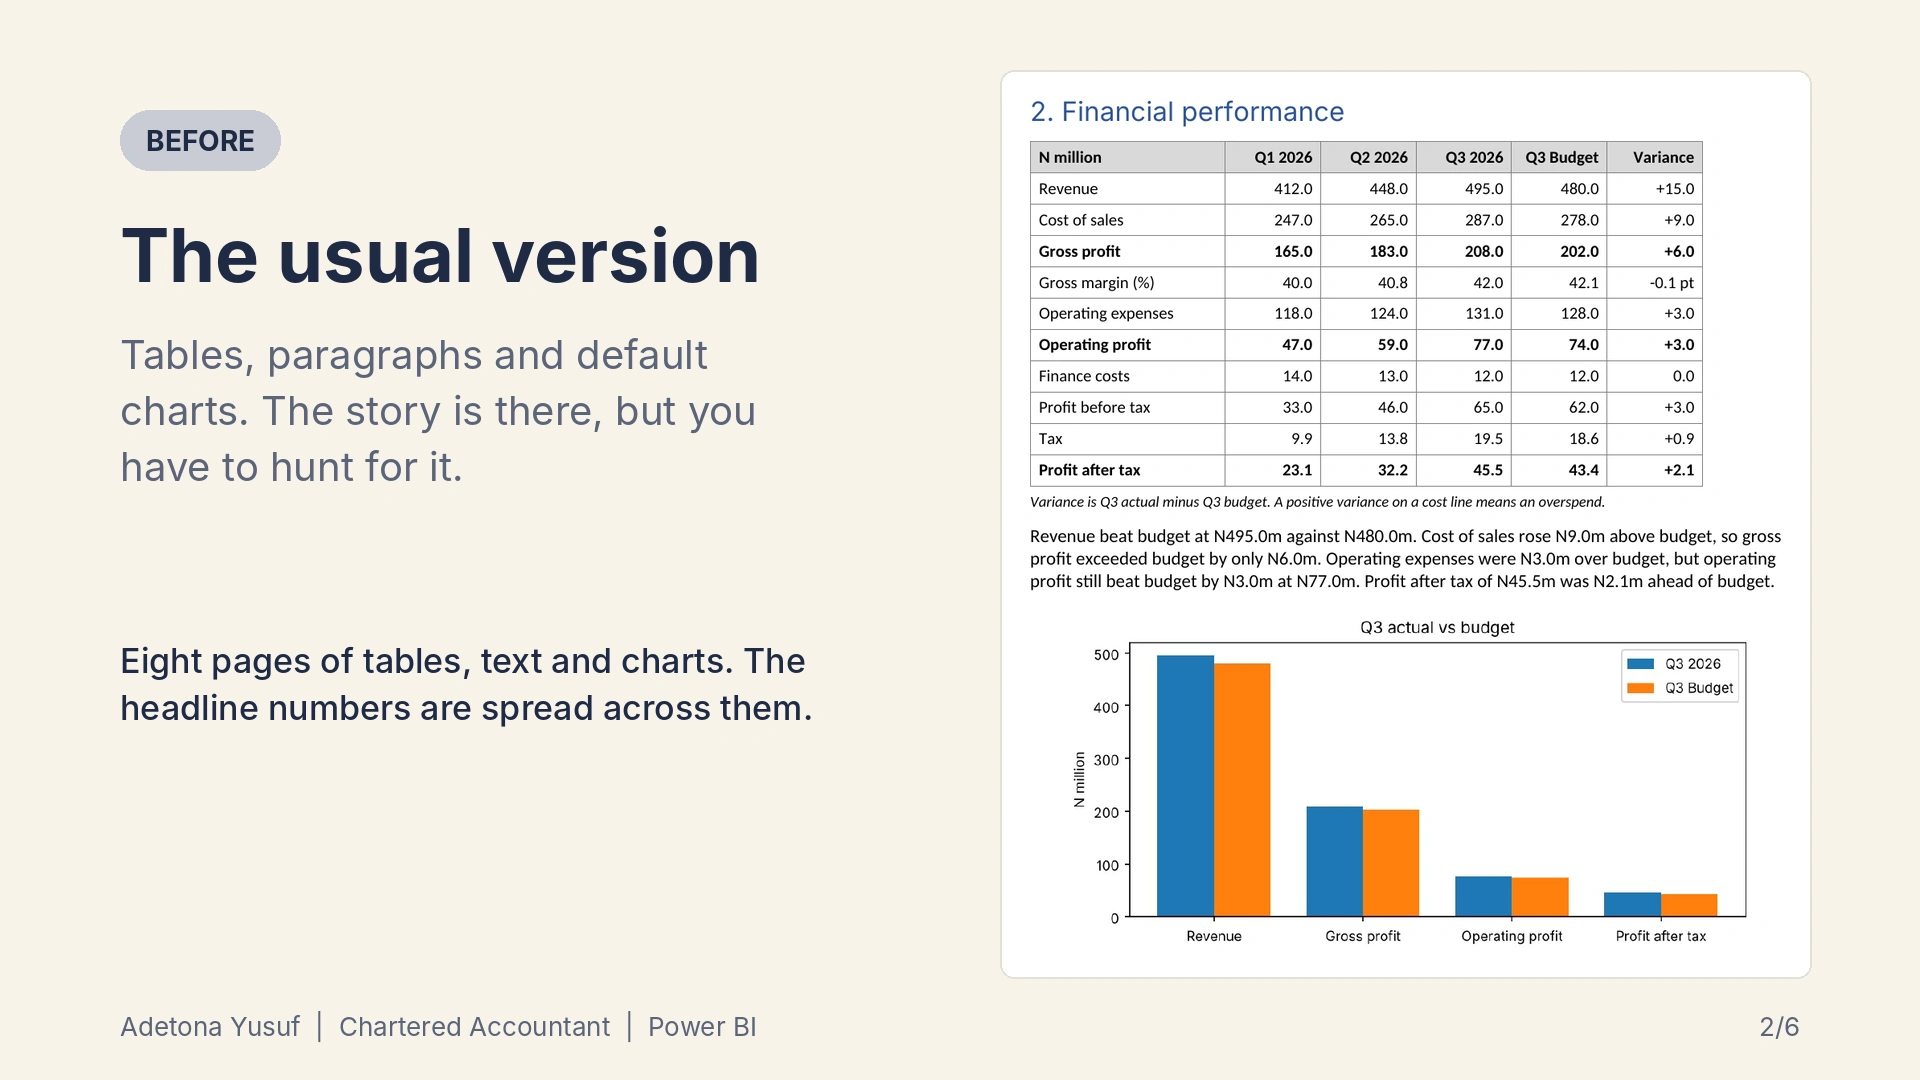
Board and management reports are often full of accurate numbers that nobody reads closely. Tables, long paragraphs and default charts make people hunt for the headline.
What I did
To show my approach, I built a fictional company’s Q3 board report two ways from the same Excel workbook: a typical plain Word version, and a redesigned one-page Power BI view.
What I changed
• Key figures (revenue, profit, closing cash, variance to budget) placed first
• A waterfall that takes cash from opening balance to closing cash
• Clear chart titles, with units where they apply
• One colour system applied across every visual
• All figures tie back to a single workbook, with DAX measures checked against it
Deliverables in this sample
• Plain “before” report (Word, 8 pages)
• Redesigned Power BI board view (PDF)
• Source workbook structure and a custom navy and gold theme
Note: The company, figures and report are fictional, created only to demonstrate my approach. No real client data is used.
What I can do for you
I design board packs, investor decks and monthly management reports for SMEs and finance teams, in Power BI and Excel. If your reports get skimmed instead of read, message me.
0 likes · 0 views · Oct 31, 2026
Project title: Board Report Redesign: Q3 Performance Pack (Power BI) Same financial data, redesigned from a plain Word report into a one-page Power BI board...


