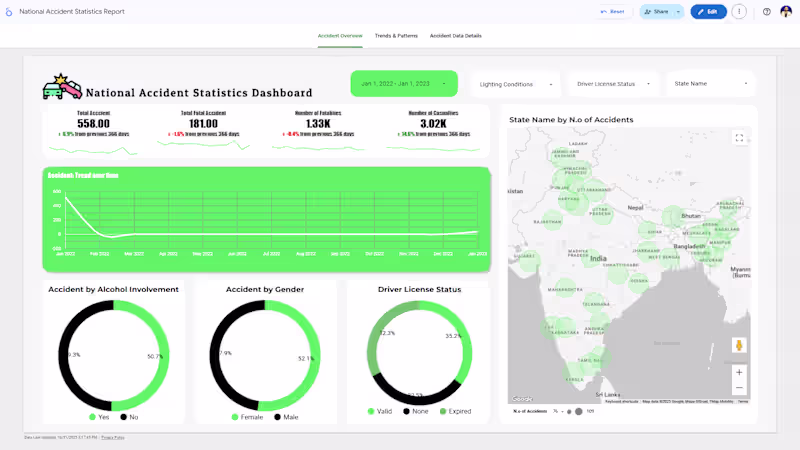
Data visualization engineer, Data Analyst, BI Expert
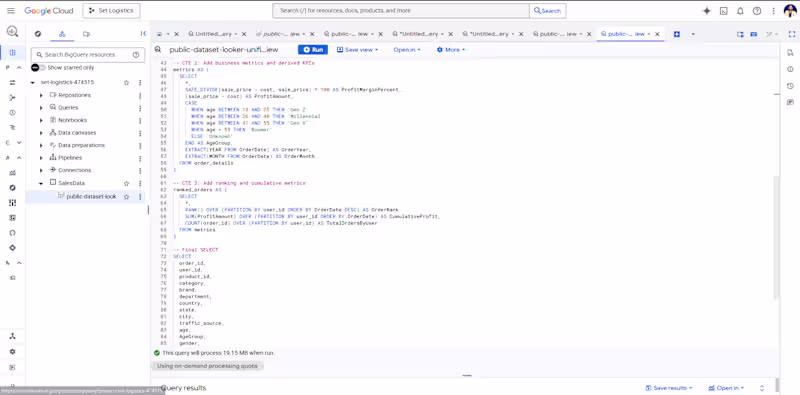
Data Scientist: Python, RStudio, ML, BI, NLP, DL, LLM
Data Scientist: Python, RStudio, ML, BI, NLP, DL, LLM
Transforming data into insights that drive growth with AI
Chartered Accountant | IFRS, US GAAP | Data Analyst 📊
Chartered Accountant | IFRS, US GAAP | Data Analyst 📊


View more →
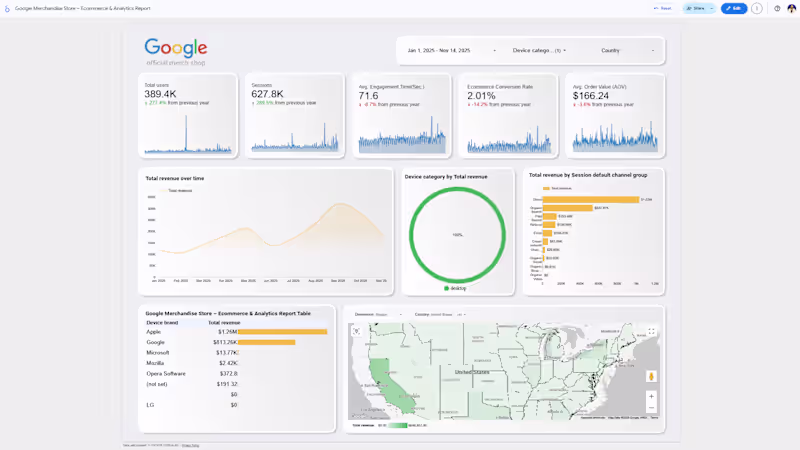
Data Insights & Dashboards Curated for Success
Data Insights & Dashboards Curated for Success


View more →
Expert Data Visualization with Tableau & Matplotlib
Expert Data Visualization with Tableau & Matplotlib

View more →
Data Analyst | SQL & Power BI Specialist
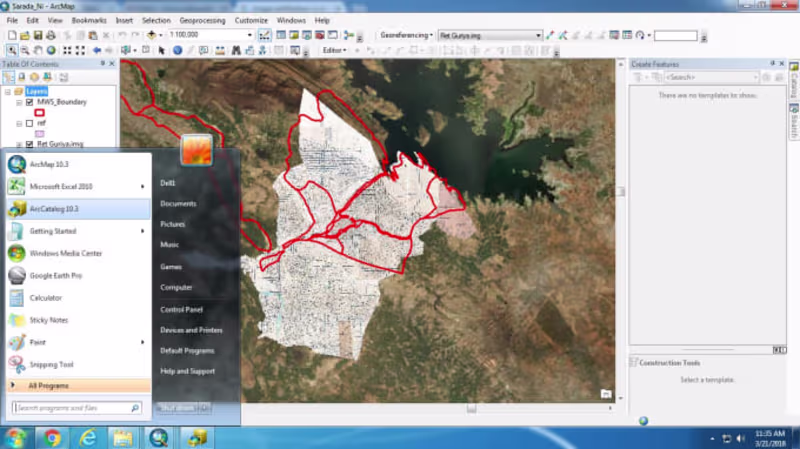
15 Yrs GIS Expert and Data Engineer 🌍
15 Yrs GIS Expert and Data Engineer 🌍