Amazon Sales Dashboard in Power BI
Vikas Kashyap
Amazon Sales Dashboard in Power BI for Seller Performance Tracking
📝 Description:
Client: Amazon Seller (E-commerce)
Project Type: Sales Analytics Dashboard
Platform: Microsoft Power BI
Data Source: Excel (Amazon Sales Export)
Problem:
The client lacked clear visibility into their Amazon sales performance across regions and products, making it difficult to track KPIs like revenue, ROI, and top-selling items. Decision-making around marketing, inventory, and pricing was delayed due to manual data handling.
Solution:
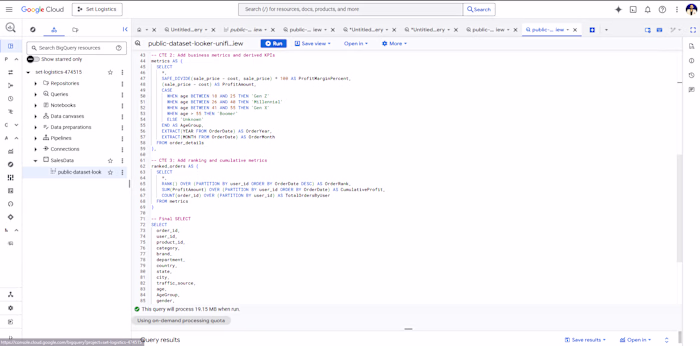
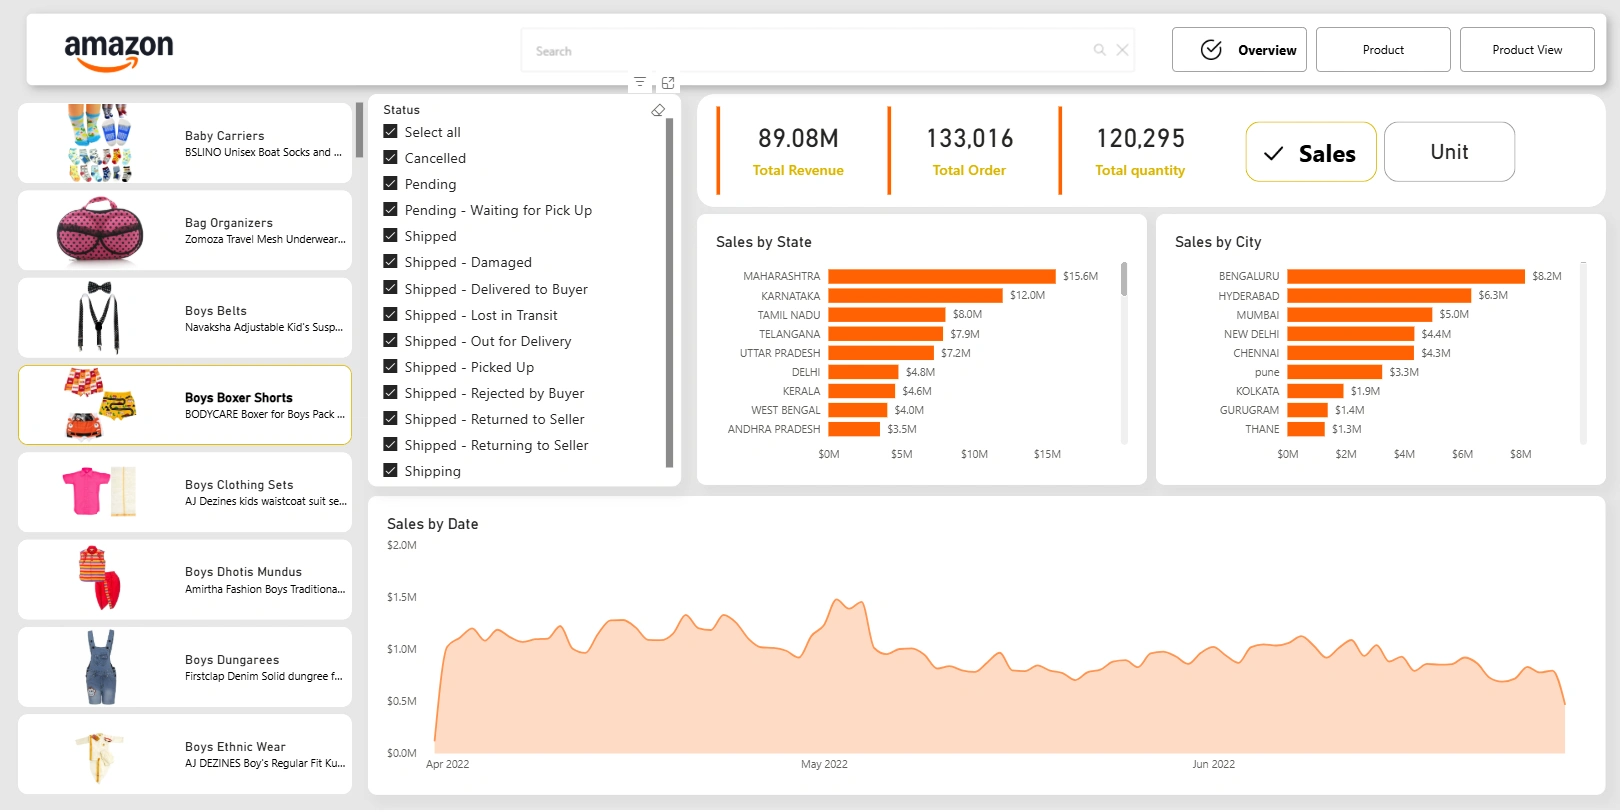
I designed a Power BI dashboard connected to their Excel sales data. Using Power Query and DAX, I modeled the data to produce meaningful insights. The dashboard includes dynamic filters, category-wise breakdowns, trend visuals, drilldowns, and KPIs that helped the client track performance in real time and make informed decisions quickly.
✨ Key Features:
Connected and automated data refresh from Excel
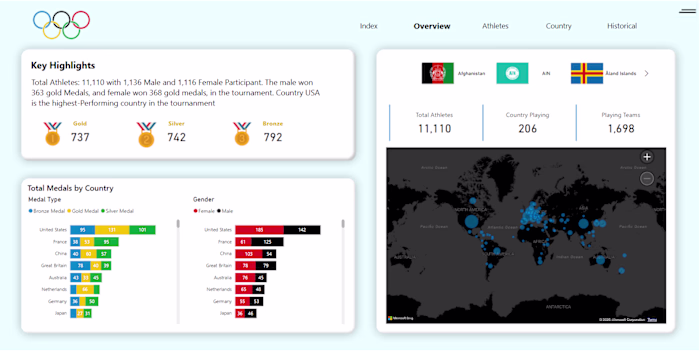
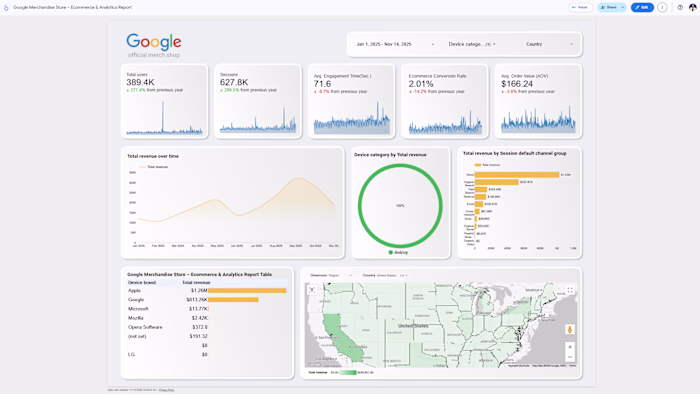
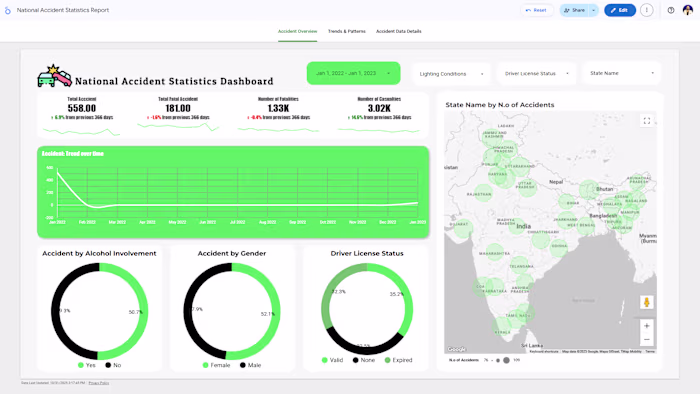
KPI tracking: Revenue, Orders, ROI, and Profitability
Filters for region, product category, and time period
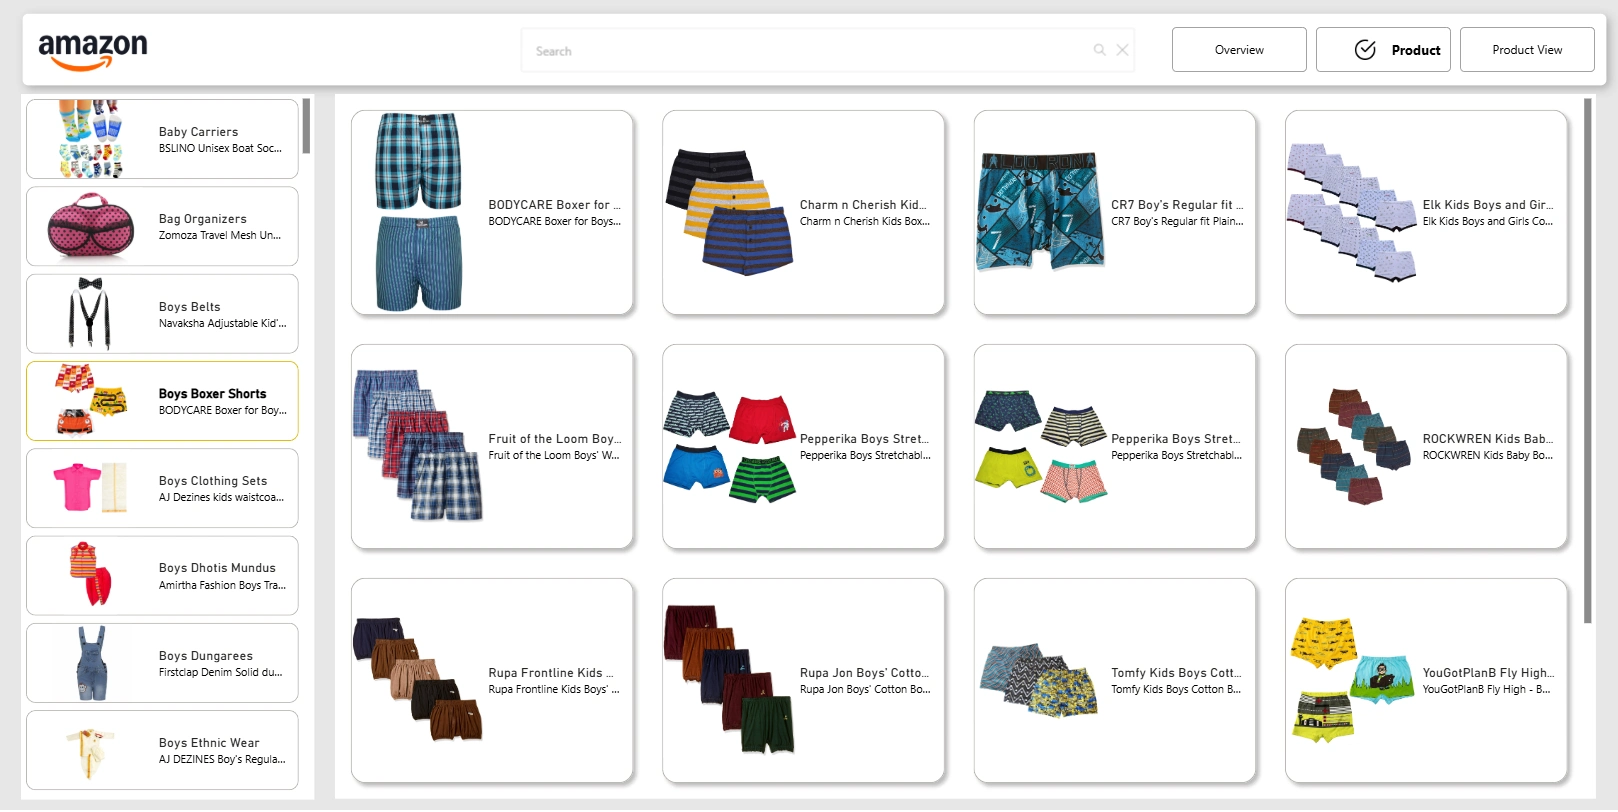
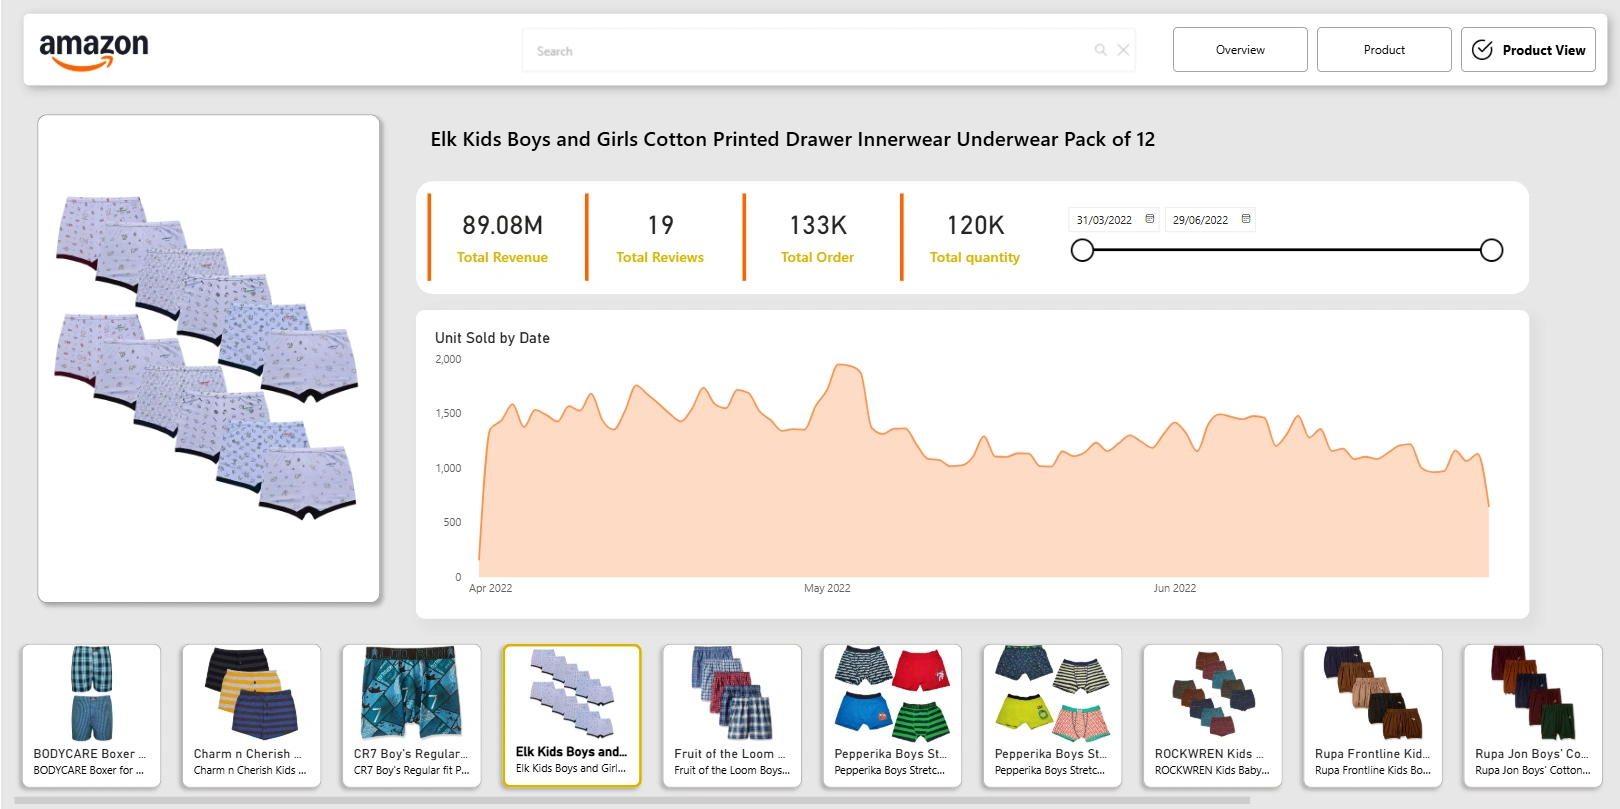
Drilldown into SKU-level performance
Sales trends and top-selling product visualizations
Insights for stock, pricing, and marketing optimization
Like this project
Posted Jul 22, 2025
Developed a Power BI dashboard for Amazon sales performance tracking.
Likes
0
Views
10
Timeline
May 23, 2024 - Jul 2, 2024