Power BI Dashboard for Paris Olympics 2024
Vikas Kashyap
Power BI Dashboard – Paris Olympics 2024 (5-Page Analytical Report)
📄 Project Description:
This project showcases a 5-page interactive Power BI dashboard built using publicly available data from Kaggle on the Paris Olympics 2024. It demonstrates my expertise in data analysis, storytelling, and dashboard design using Microsoft Power BI.

The goal of this project was to transform raw Olympic data into a visually compelling and insightful dashboard that could serve media analysts, sports federations, researchers, or data learners with powerful, real-time analysis tools.
🧩 Dashboard Highlights:
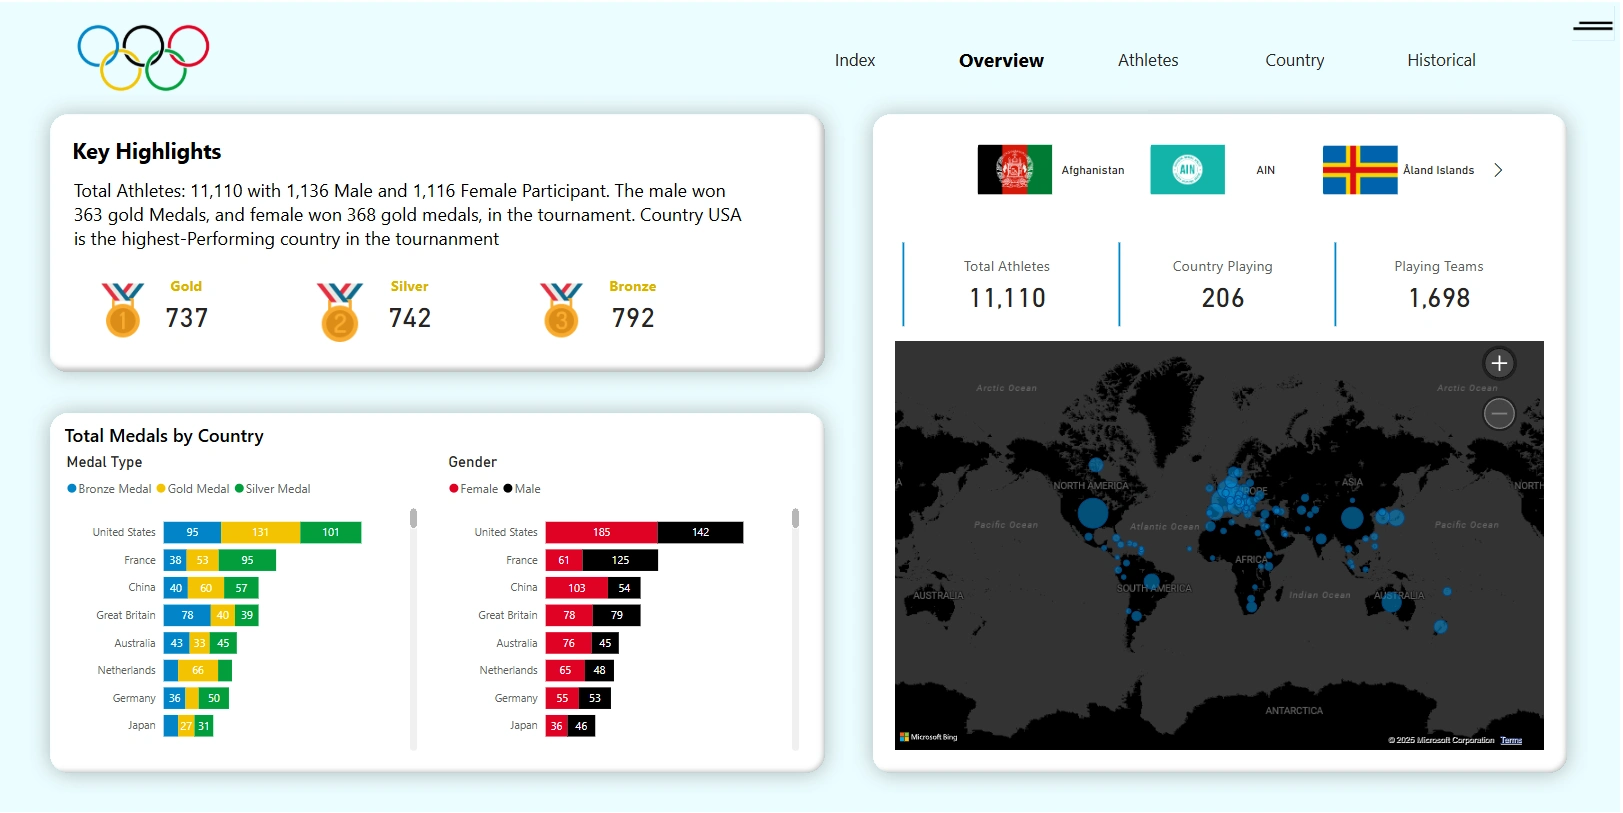
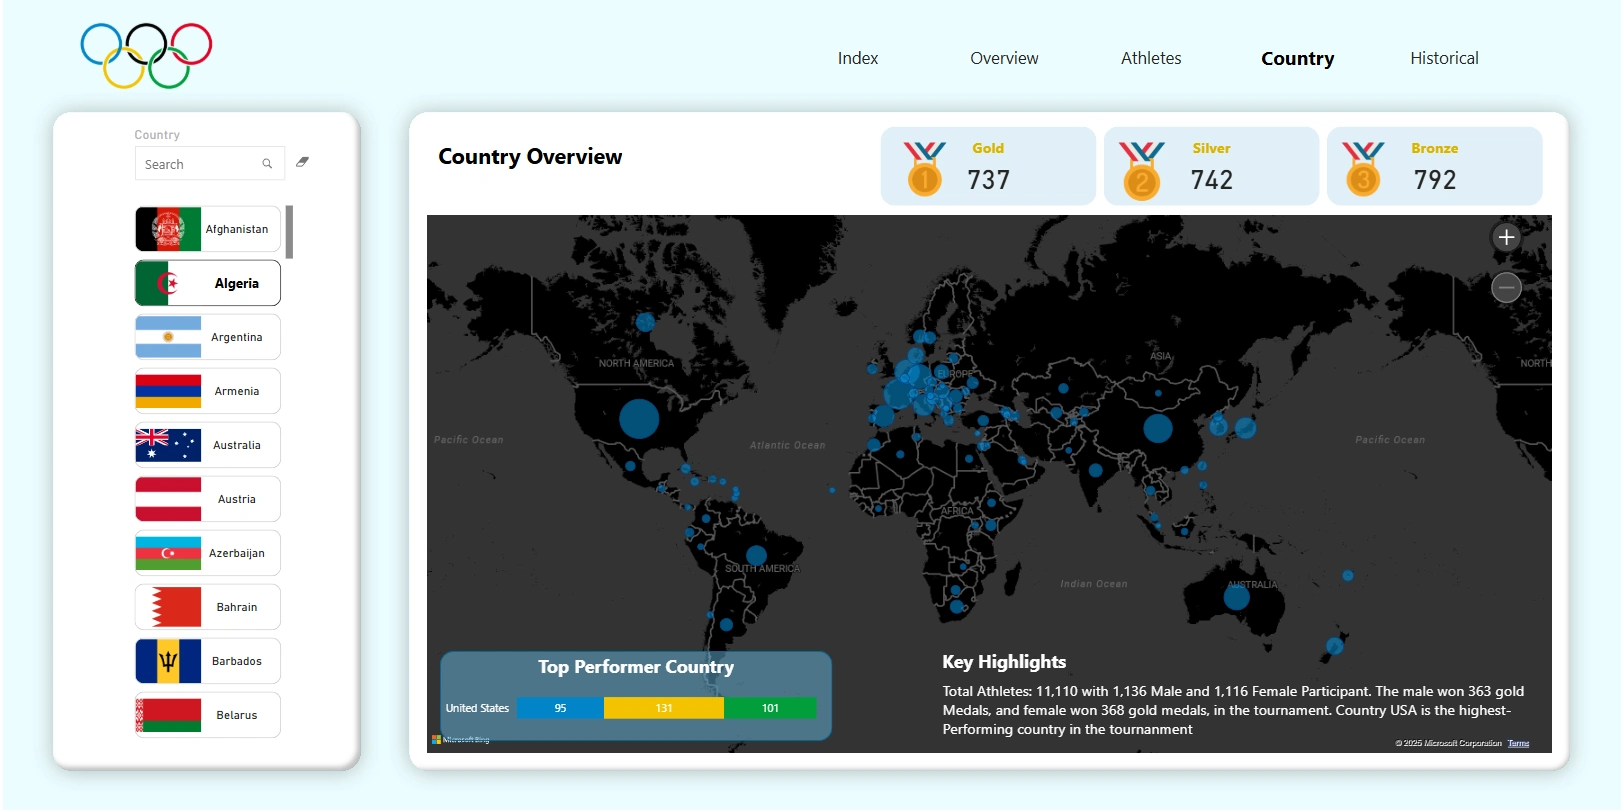
1.) Medal Summary Overview – Total medals by country, sport, and event with dynamic filters.
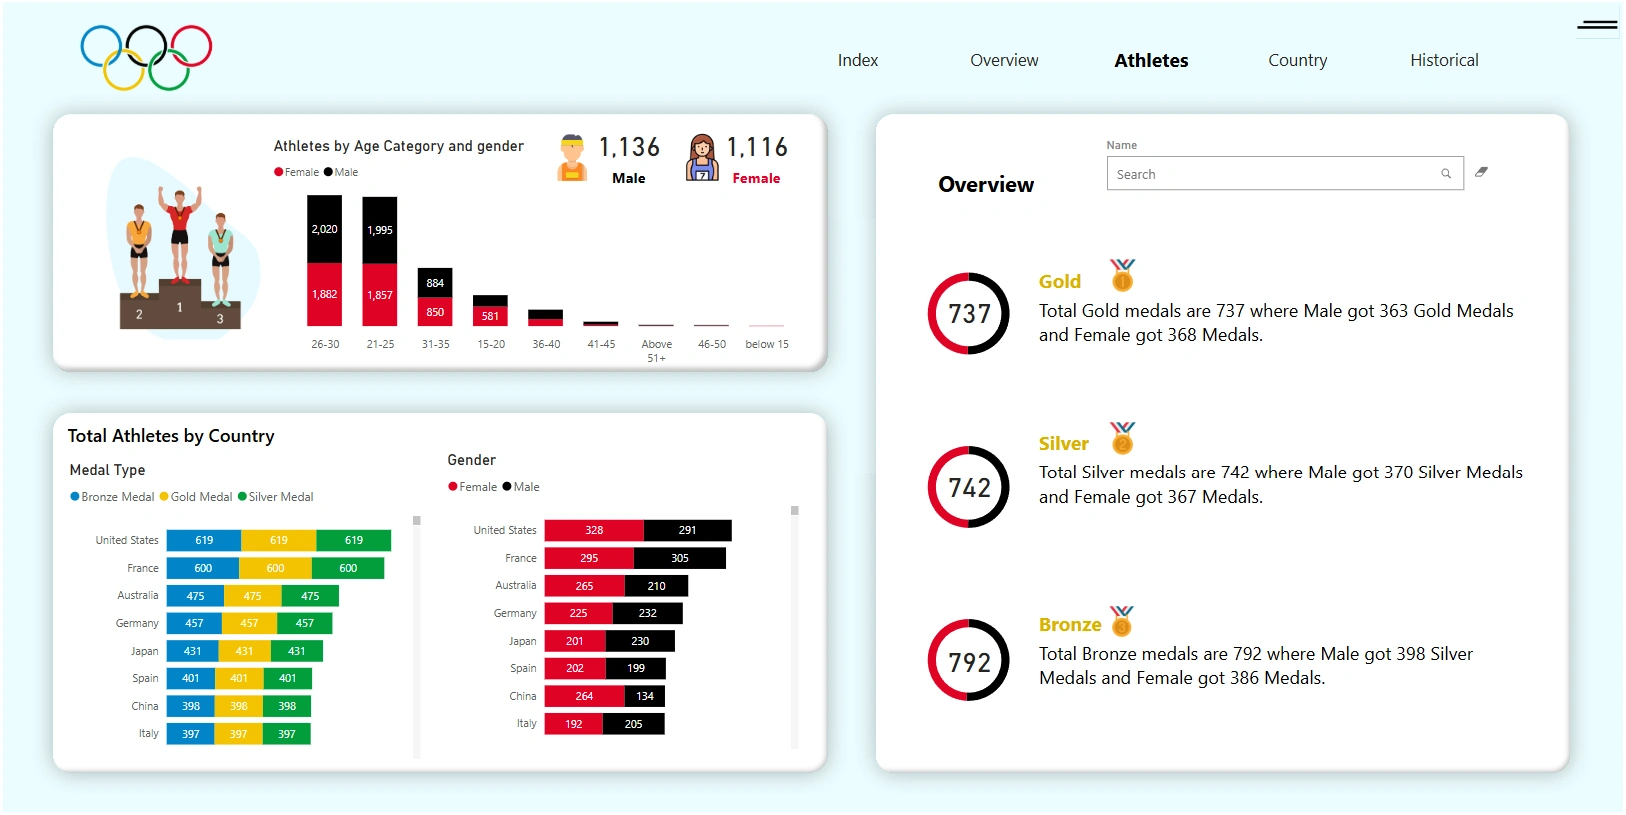
2.) Athlete Demographics – Age, gender, nationality breakdowns with visual segmentation.
3.) Top Performers Analysis – Most successful athletes, countries, and disciplines.
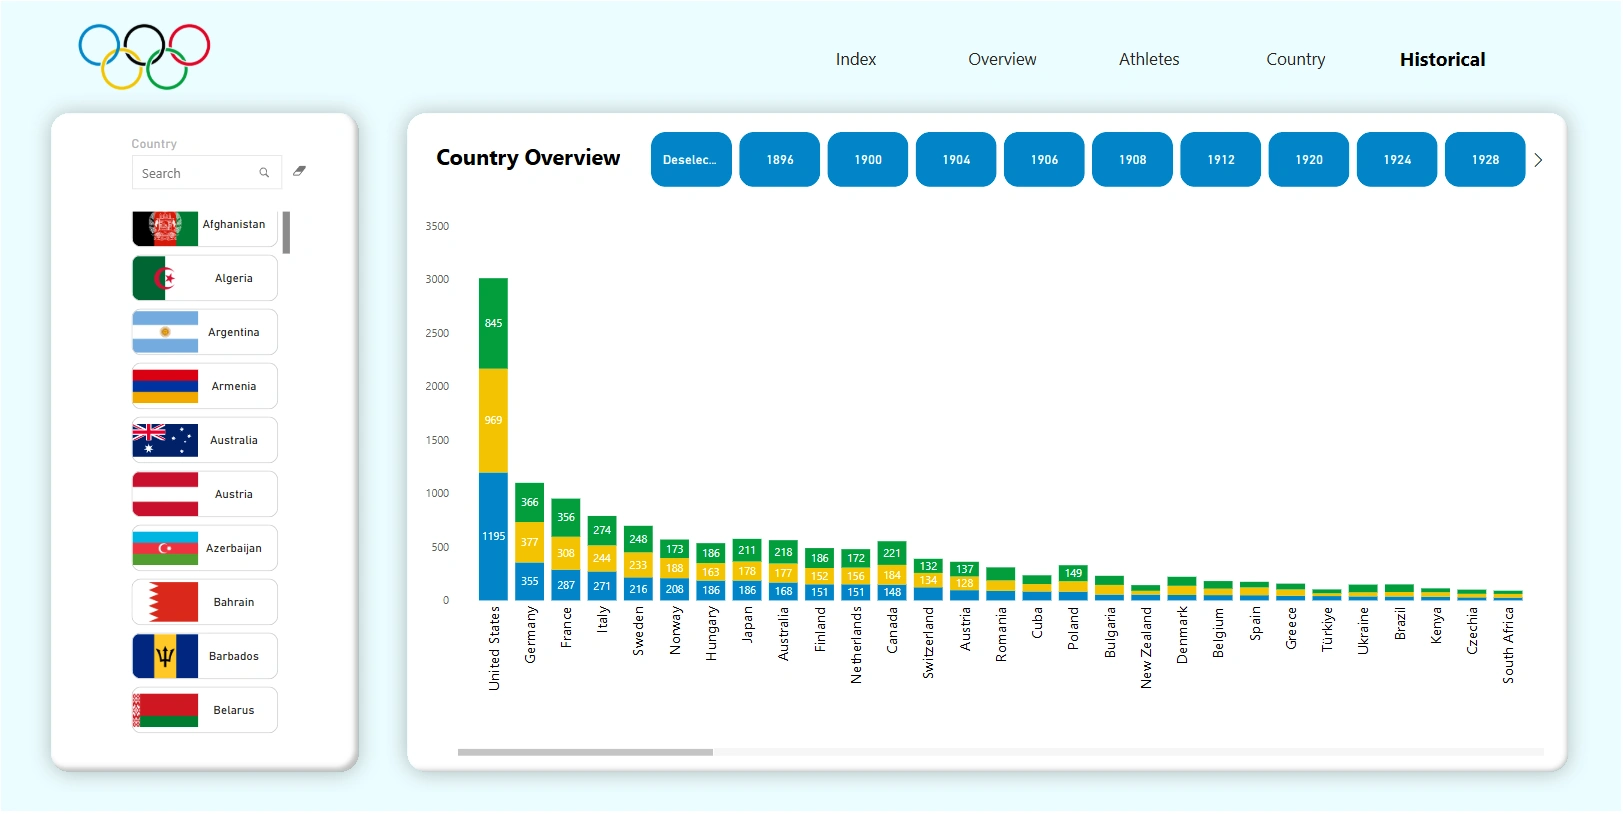
4.) Historical Trends – Comparison of performance over different Olympic years.
5.) Interactive Navigation – Drillthroughs, slicers, and customized tooltips for detailed exploration.
🛠 Tools & Techniques Used:
Power BI Desktop
Power Query for data transformation
DAX for custom metrics and KPIs
Custom Visuals for advanced storytelling
Kaggle Dataset (Paris Olympics & Historical Data)
🌟 Project Impact:
This dashboard illustrates how complex Olympic data can be translated into an intuitive, dynamic, and professional-grade report, useful for stakeholders across industries — from sports journalism and event planning to academic research and data training.
📁 Deliverables:
Power BI (PBIX) file
Dashboard Screenshots (for preview or documentation)
Optional: Embedded link or video walkthrough (on request)
Like this project
Posted May 31, 2025
Developed a Power BI dashboard for Paris Olympics 2024 using Kaggle data.
Likes
0
Views
2
Timeline
Jan 31, 2024 - Feb 28, 2024