National Accident Statistics Dashboard in Google Looker Stud...
Vikas Kashyap
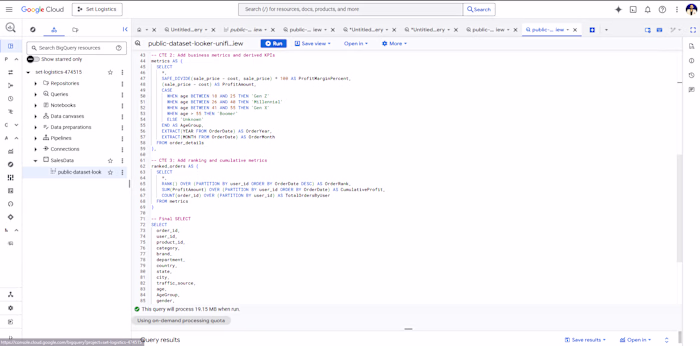
National Accident Statistics Dashboard in Google Looker Studio:
I built an interactive Looker Studio dashboard using Google Sheets as the data source to visualize national accident statistics. The report analyzes accidents by region, time, severity, and demographics. A scheduled data re:fresh every 15 minutes keeps the dashboard updated in real time. As a Data Visualization Expert, I combined automation and design to deliver a clean, insightful, and dynamic Looker Studio dashboard for data-driven decision-making.
🎉 💯 🎉
Like this project
Posted Nov 2, 2025
National Accident Statistics Dashboard in Google Looker Studio: I built an interactive Looker Studio dashboard using Google Sheets as the data source to visu...
Likes
0
Views
2
Timeline
Apr 1, 2025 - May 6, 2025