
Poonam Kashyap
Business Intelligence Specialist | Power BI & Excel Expert
- 3
- Followers


Road Accident Analysis Dashboard – Power BI Project
0
4
⚡ Energy Flow Analysis Dashboard – Power BI Project
This interactive Power BI dashboard provides a comprehensive view of energy generation, consumption, and efficiency across multiple sources and regions. Designed to help energy companies and policymakers make data-driven decisions, it visualizes how energy moves through different stages — from production to end usage.
🔍 Key Insights & Features:
Detailed breakdown of energy input, output, and loss percentages.
Interactive visuals to track renewable vs. non-renewable energy usage.
KPIs highlighting total energy generated, consumed, and saved.
Trend charts showing performance over time and by location.
This project demonstrates my ability to transform complex energy data into clear, actionable insights using Power BI.
0
78
🚦 Road Accident Analysis Dashboard – Power BI Project
This interactive Power BI dashboard provides a detailed analysis of road accidents across multiple regions, helping authorities and businesses identify key risk factors and improve road safety strategies. It offers a visual overview of accident frequency, causes, vehicle types involved, and casualty trends over time.
🔍 Key Insights & Features:
Trend analysis by accident severity, location, and time period.
Interactive filters to compare regions and vehicle categories.
Visual KPIs highlighting total accidents, fatalities, and injury rates.
Heatmaps showing accident hotspots for targeted interventions.
This project demonstrates my ability to clean, model, and visualize large datasets using Power BI.
Thanks!
0
100
🛍️ Shopify Sales & Customer Funnel Dashboard (Power BI Project)
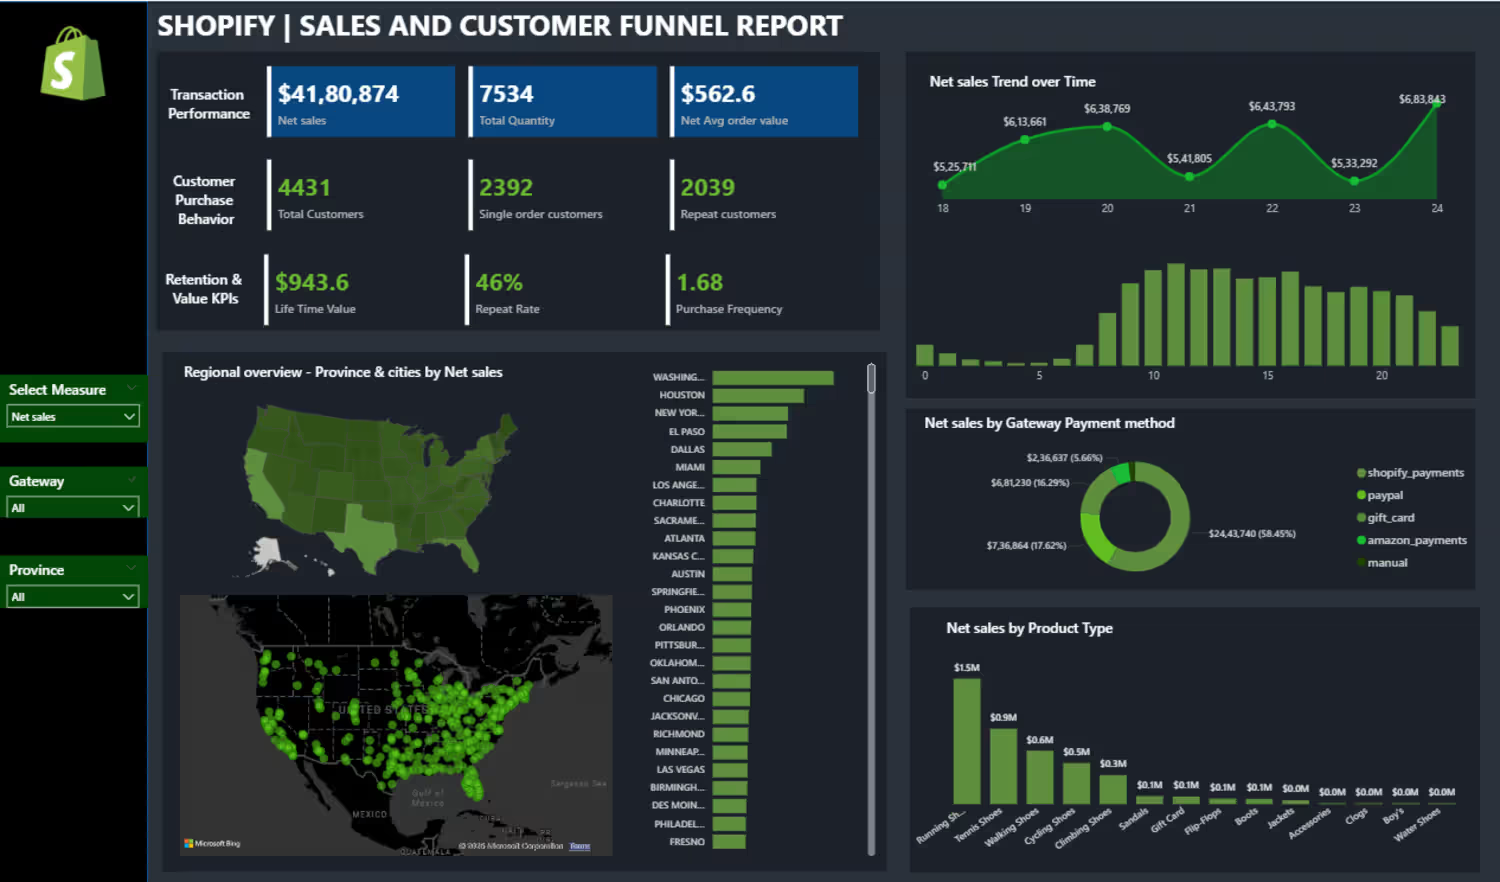
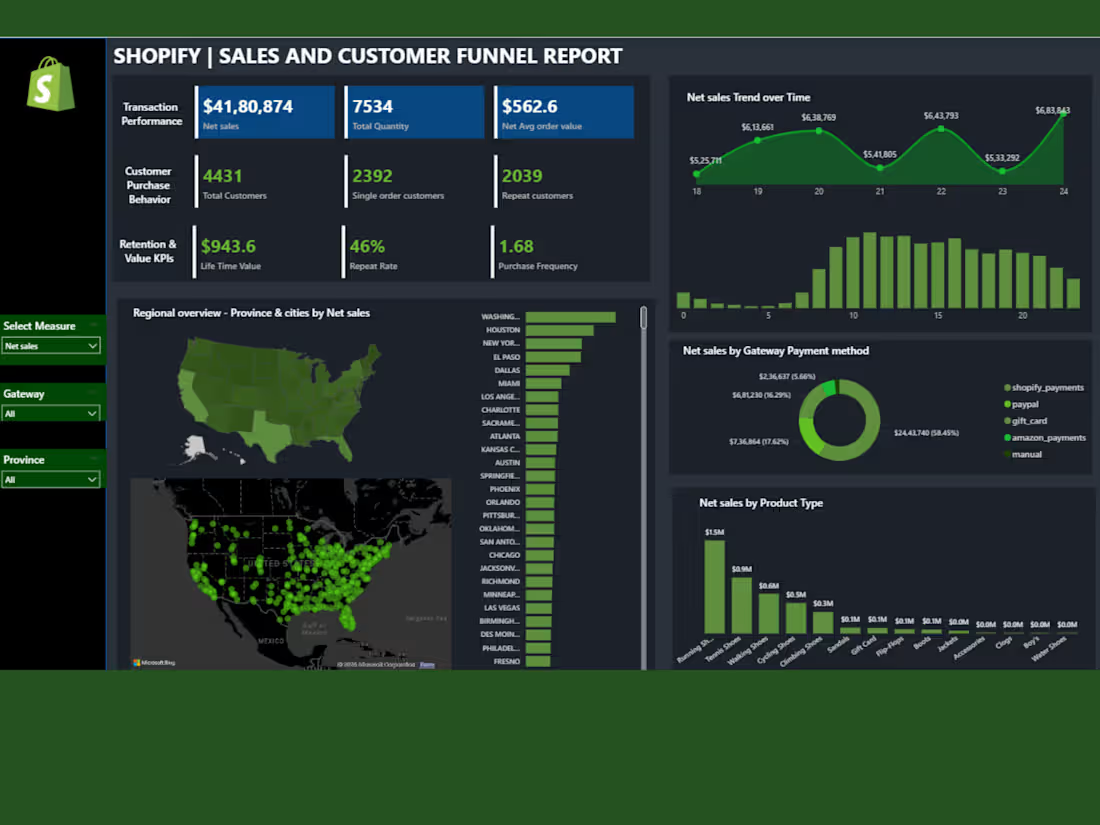
I designed this interactive Shopify Sales & Customer Funnel Dashboard in Microsoft Power BI to help e-commerce store owners gain deep insights into their sales, customer behavior, and performance trends. The dashboard converts raw Shopify data into a clear visual story that supports smarter, data-driven decisions.
Thanks!
0
71