Poonam Kashyap
Business Intelligence Specialist | Power BI & Excel Expert
Ready for work
Poonam is ready for their next project!
⚡ Energy Flow Analysis Dashboard – Power BI Project
This interactive Power BI dashboard provides a comprehensive view of energy generation, consumption, and efficiency across multiple sources and regions. Designed to help energy companies and policymakers make data-driven...
🚦 Road Accident Analysis Dashboard – Power BI Project
This interactive Power BI dashboard provides a detailed analysis of road accidents across multiple regions, helping authorities and businesses identify key risk factors and improve road safety strategies. It offers a visual...
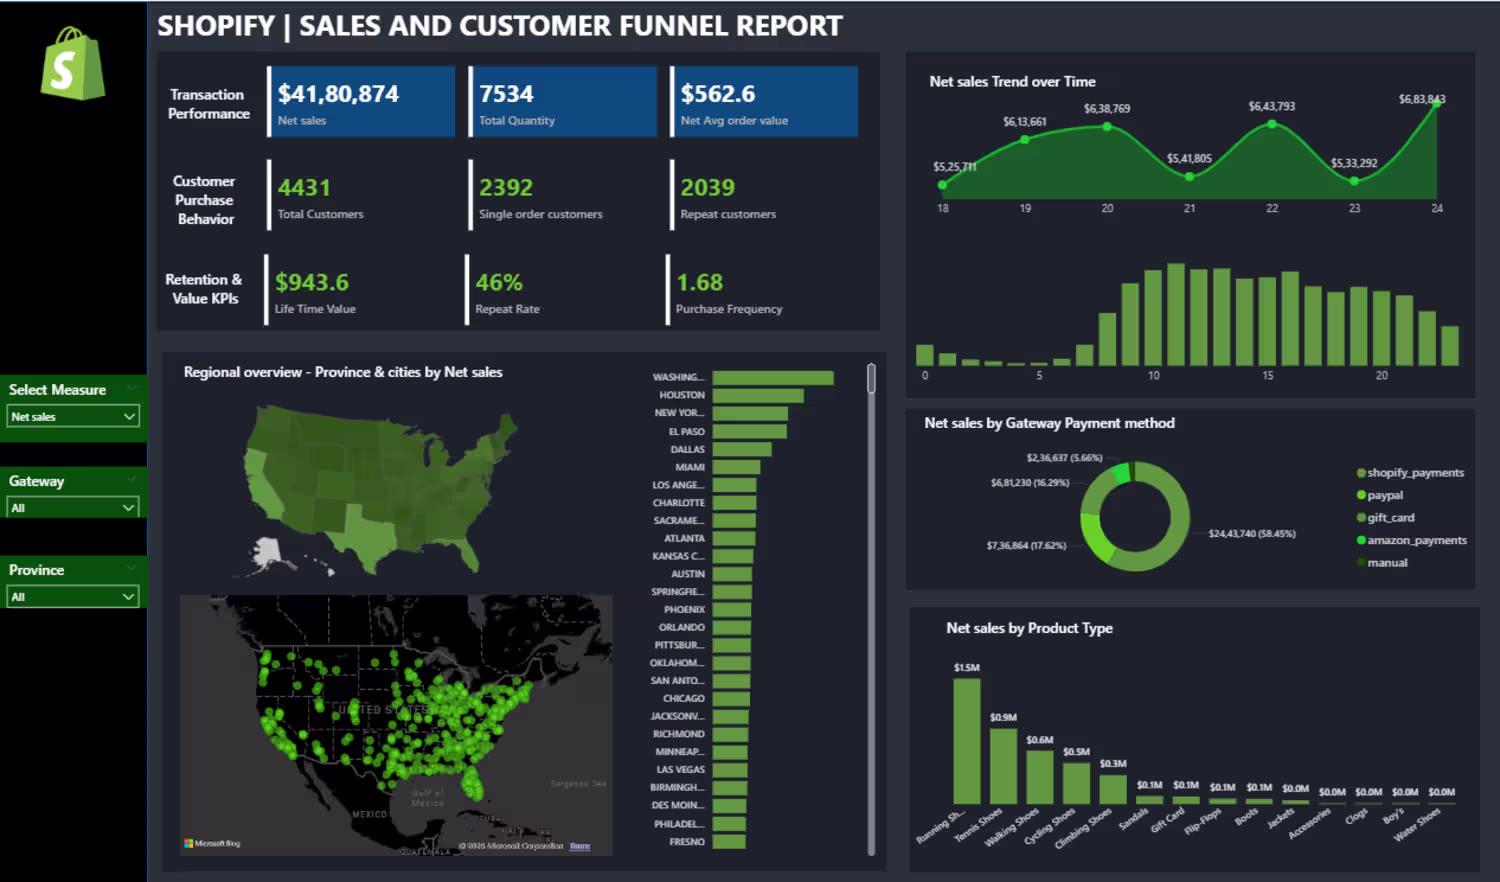
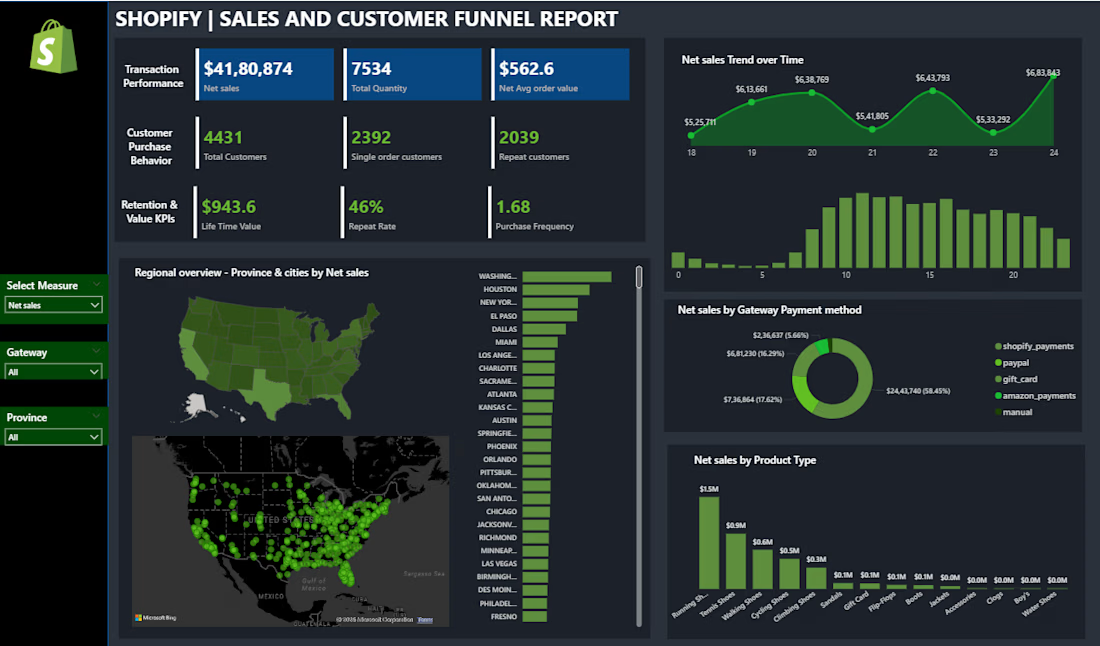
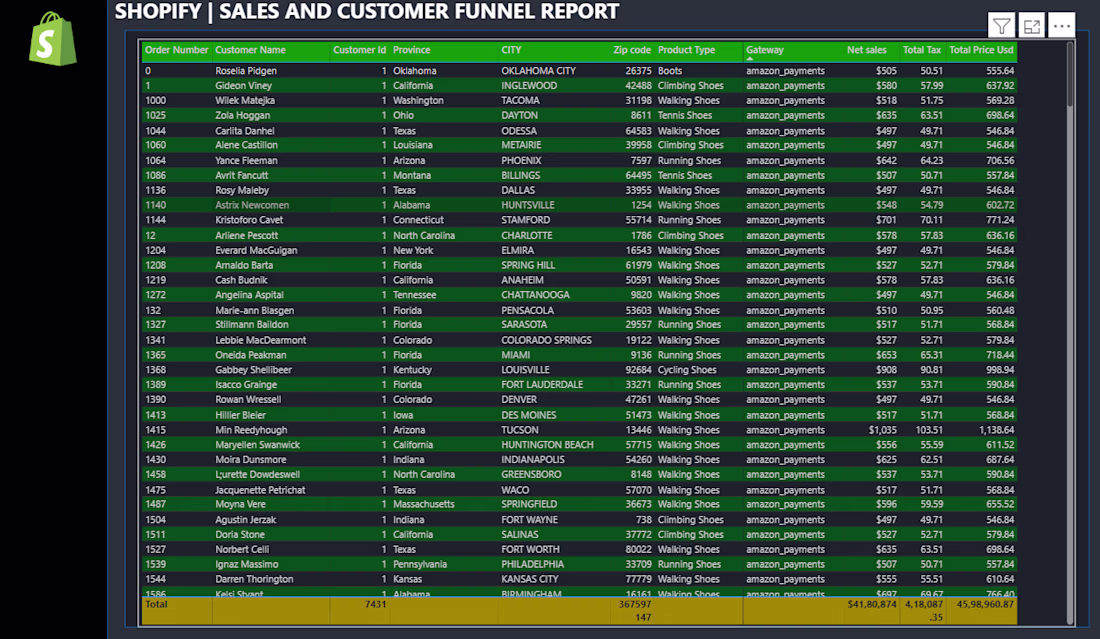
🛍️ Shopify Sales & Customer Funnel Dashboard (Power BI Project)
I designed this interactive Shopify Sales & Customer Funnel Dashboard in Microsoft Power BI to help e-commerce store owners gain deep insights into their sales, customer behavior, and performance trends. The...
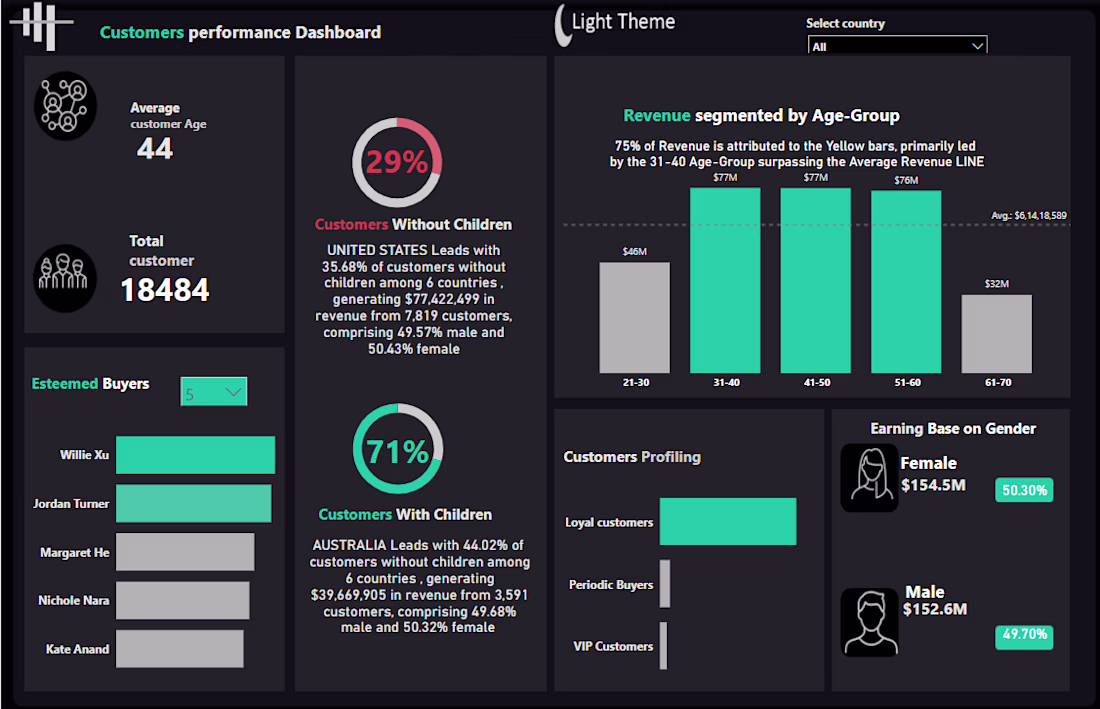
🧩 Customer Performance Dashboard – Power BI Project
This interactive Power BI dashboard offers a detailed view of customer demographics, buying behavior, and revenue segmentation across multiple countries. It helps businesses understand their audience better and make data-driven...
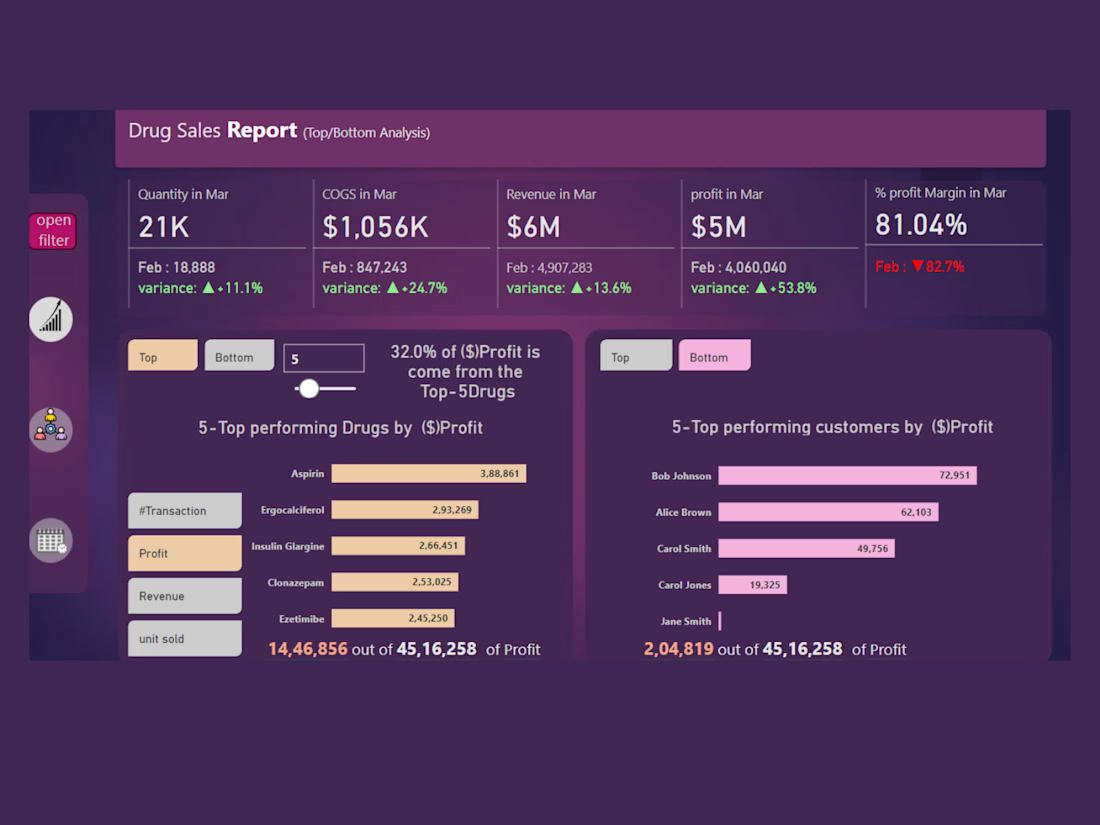
🚀 Drug Sales Analysis Dashboard | Power BI Project
An interactive and visually compelling Power BI dashboard designed to deliver clear insights into drug sales performance. It tracks key KPIs such as Revenue, Profit, COGS, and Margin, with top/bottom analysis and dynamic filters...