The network for creativity
Join 1.25M professional creatives like you
Connect with clients, get discovered, and run your business 100% commission-free
Creatives on Contra have earned over $150M and we are just getting started
Back to feedPost
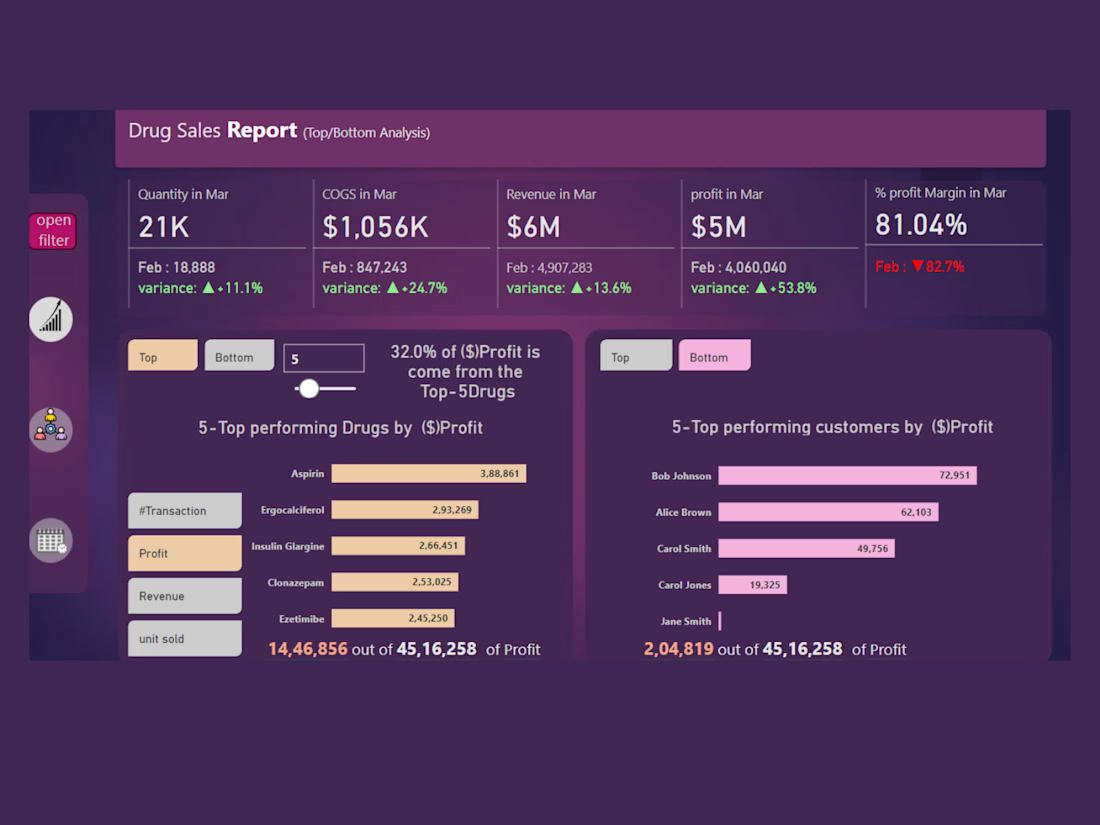
🚀 Drug Sales Analysis Dashboard | Power BI Project
An interactive and visually compelling Power BI dashboard designed to deliver clear insights into drug sales performance. It tracks key KPIs such as Revenue, Profit, COGS, and Margin, with top/bottom analysis and dynamic filters for month and year selection.
Built in just 5 hours, this project demonstrates my ability to create fast, accurate, and insight-driven dashboards that help businesses make smarter decisions.
✨ If you're looking for a dashboard that turns raw data into actionable insights — let’s collaborate!
- Poonam Kashyap
#PowerBI #DataAnalytics #DashboardDesign #BusinessIntelligence #DataVisualization #DataInsights
The network for creativity
Join 1.25M professional creatives like you
Connect with clients, get discovered, and run your business 100% commission-free
Creatives on Contra have earned over $150M and we are just getting started
Trending
Claude
Claude has entered the design space. How are you using Claude Design?
Contra University
Learn from expert creatives how to earn more using next-gen AI tools.
creativeaiflow
Creative AI workflows are evolving. What tools do you use, and what are their strengths and weaknesses?
freelancerlife
Freelancer life is wins, pivots, and everything in between. What’s yours right now?