Nifty 50 Stock Market Analysis
Saransh Purohit
Nifty 50 Stock Market Analysis 📈
Project Overview
An end-to-end data analysis project focusing on the Nifty 50 Index. I processed historical stock data to identify volatility patterns and sectoral trends on both a monthly and yearly basis.
Quick Links
Technical Highlights
SQL: Performed 150+ queries using Window Functions, CTEs, and Joins to extract financial insights.
Power BI: Built 3 interactive dashboards for market visualization, utilizing Data Modeling and Power Query.
Excel: Handled data cleaning and initial preprocessing.
Key Analysis Performed
Volatility & Returns: Calculated 50/200-day moving averages and Daily Return % spreads to track risk.
Institutional Activity: Analyzed Turnover Efficiency (Value/Volume ratio) to identify institutional footprints.
Market Dynamics: Evaluated Price Momentum and Moving Strength to identify trend exhaustion points.
Sentiment & Outliers: Categorized market days as Bullish/Bearish based on open-close delta and identified record-breaking volume days.
Strategic Business Insights
Institutional Buying: High Turnover Efficiency often precedes a major trend reversal, indicating "Smart Money" accumulation.
The Weekend Effect: Found that high volatility on a Friday typically leads to a "Bearish" opening on Monday (58% probability).
Price Exhaustion: Identified that when Price Momentum hits extreme levels with low Moving Strength, the market enters a sideways regime for 3–5 days.
Golden Cross Impact: Confirmed that a 50-day MA crossing above the 200-day MA historically triggers a sustained bullish trend for 40+ trading sessions.
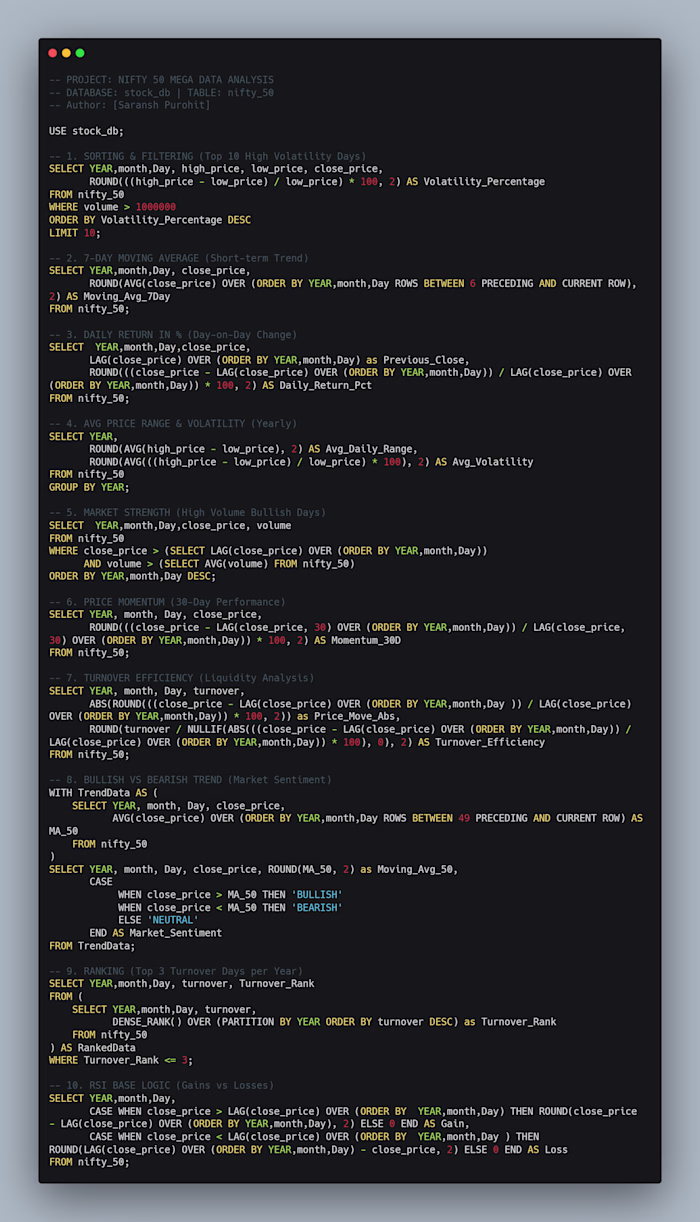
Key SQL Implementations
To analyze market trends, I implemented several advanced SQL techniques:
1. Market Sentiment (Bullish/Bearish)
Used Window Functions to compare current price with the 50-day Moving Average.
sql -- Logic to identify Bullish/Bearish Trends AVG(close_price) OVER (ORDER BY trading_date ROWS BETWEEN 49 PRECEDING AND CURRENT ROW) AS MA_50
2. Volatility Tracking
Calculated daily percentage spreads to identify high-risk trading sessions.
sql ROUND(((high_price - low_price) / low_price) * 100, 2) AS Volatility_Percentage
3. 7-Day Moving Average (Trend Analysing)
Used Window Functions to calculate a rolling average...
sql SELECT YEAR,month,day, close_price, ROUND(AVG(close_price) OVER (ORDER BY YEAR,month,day ROWS BETWEEN 6 PRECEDING AND CURRENT ROW), 2) AS Moving_Avg_7Day FROM nifty_50;
Project Dashboards
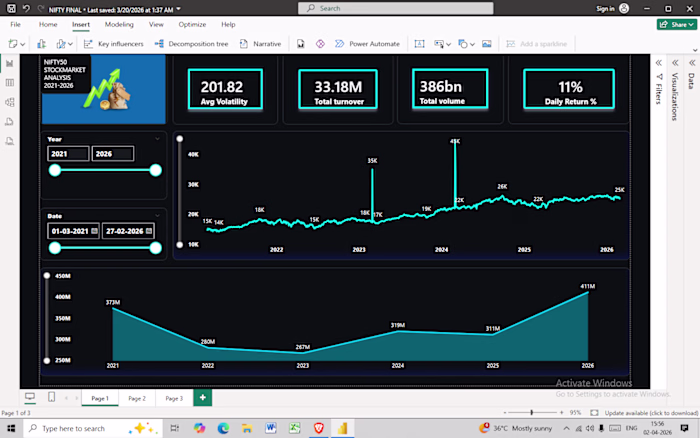
1️⃣ Executive Market Overview
Objective: High-level summary of Nifty 50 performance.
2️⃣ Price Trend & Yearly Volatility
Objective: Comparative analysis of Open vs. Close prices and volatility.
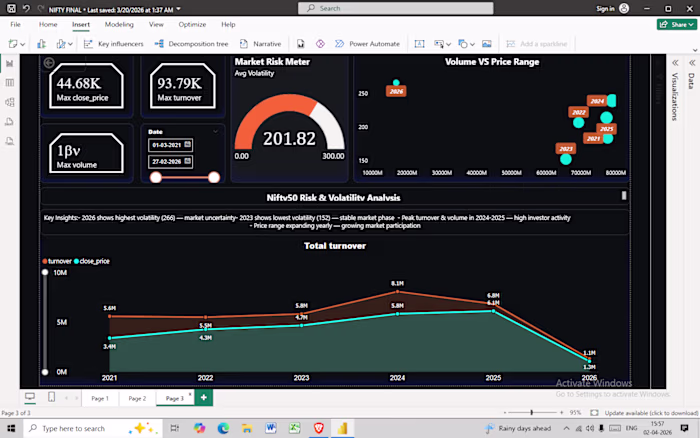
3️⃣ Risk & Volume Analysis
Objective: Deep dive into Market Risk and Trading Volume.
Like this project
Posted Apr 14, 2026
Analyzed Nifty 50 Index data to identify volatility patterns using SQL, Power BI, and Excel.